MICROSOFT POWER BI - AT THE TOP OF THE GARTNER MAGIC QUADRANT FOR ANALYTICS AND BI

Microsoft Power BI - in the Gartner Magic Quadrant for Analytics and BI for the 14th time ... and farthest to the right of the quadrant for the third year in a row. That is, at the top of the Leaders and Visionaries. Microsoft has massive market reach through Microsoft Office and a comprehensive and visionary product roadmap. Microsoft Power BI has [...]
POW3R DIGITAL

POW3R DIGITAL | November 10 - 11, 2020Microsoft BI Meets IBM i Learn from the best, meet leading solution providers and benefit from the concentrated knowledge of speakers and experts. Hosted by ITP-VERLAG and COMMON Deutschland e.V., education sessions and face-2-face meetings will pass on impulses and quick wins in cooperation with IBM specialists. KOM4TEC EDUCATION SESSION The KOM4TEC Analytics [...]
Power BI alarm function

Data alert for business-critical metrics.
Hotline statistics

In the following example, one of our customers asked us to analyze their service hotline in order to evaluate its performance. For this purpose, relevant key figures were defined, data from various systems was queried and, of course, visualized with the help of state-of-the-art Power BI. The goal was to create a detailed evaluation of the service hotline in a central location for our customers.
OPTIMIZATION OF POWER BI REPORTS
OUTPUT SITUATION We recently had another assignment with a Power BI customer from the logistics industry. The customer uses Power BI to create various reports in controlling and in the area of logistics itself and approached us with the desire to further optimize and sharpen existing reports (logistical evaluations such as warehouse movements). The challenge [...]
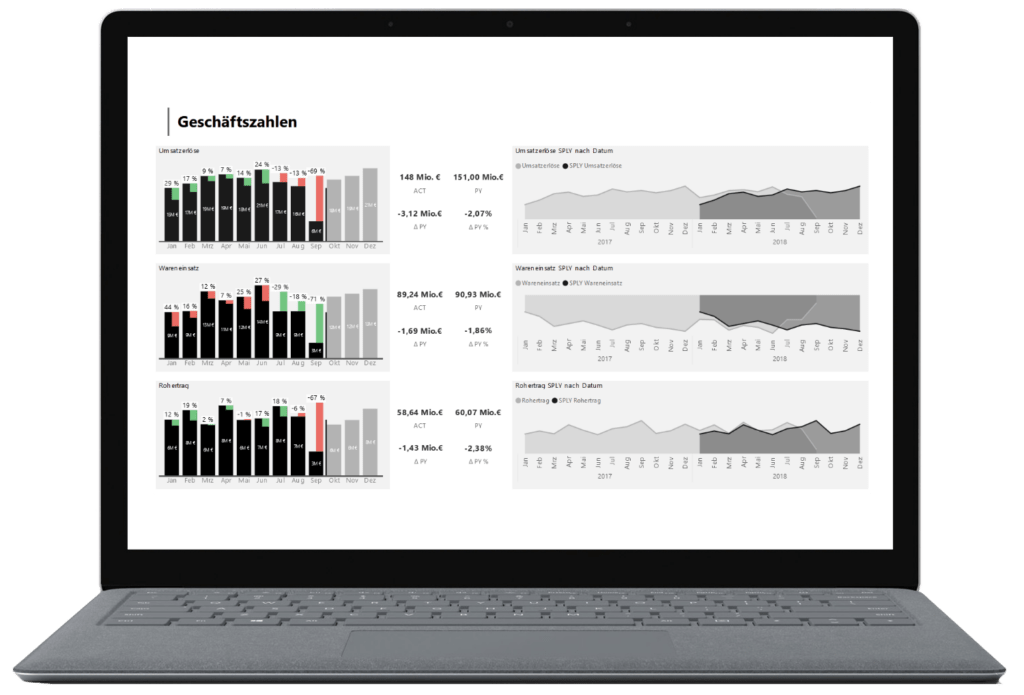
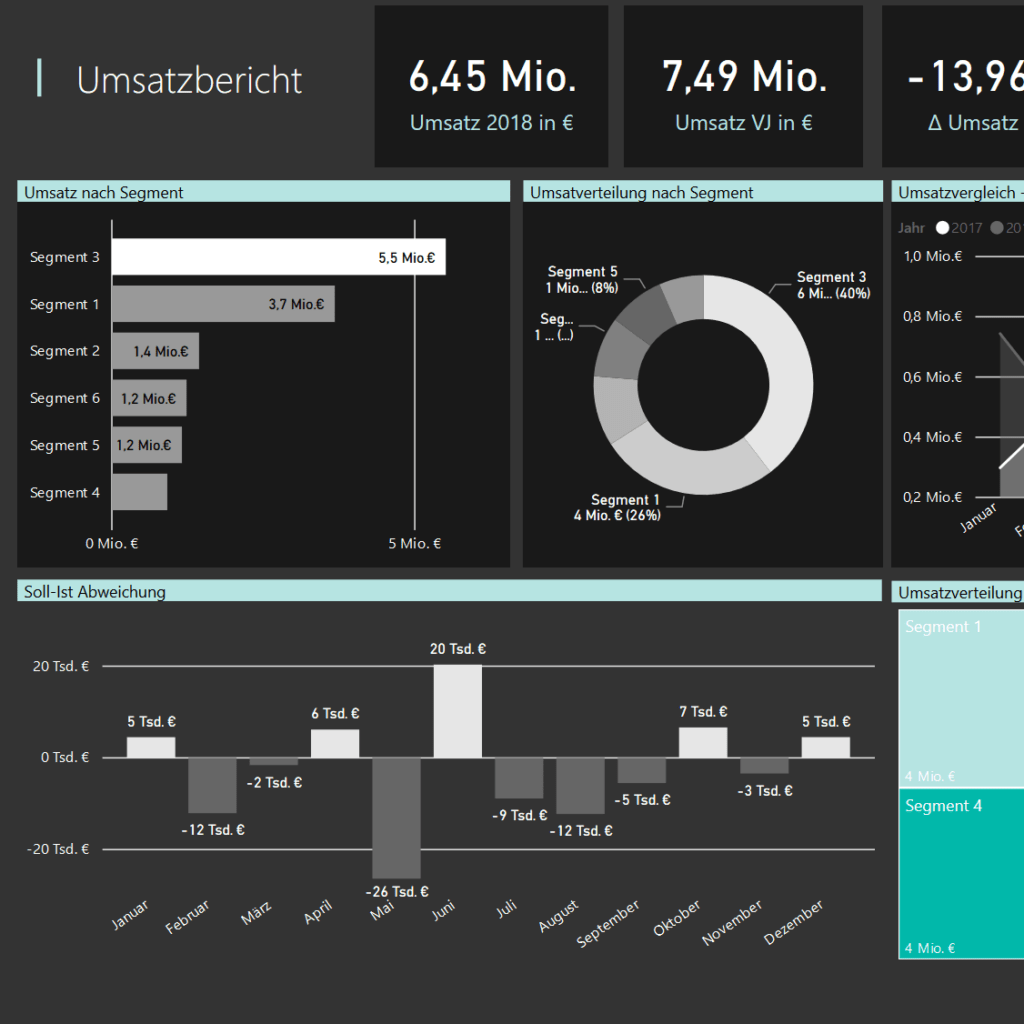
SALES AND REVENUE REPORT
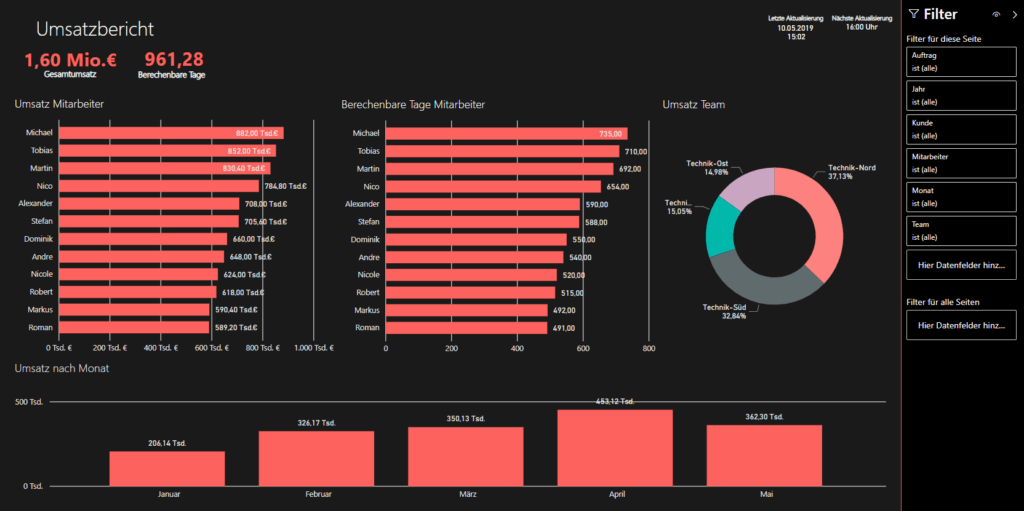
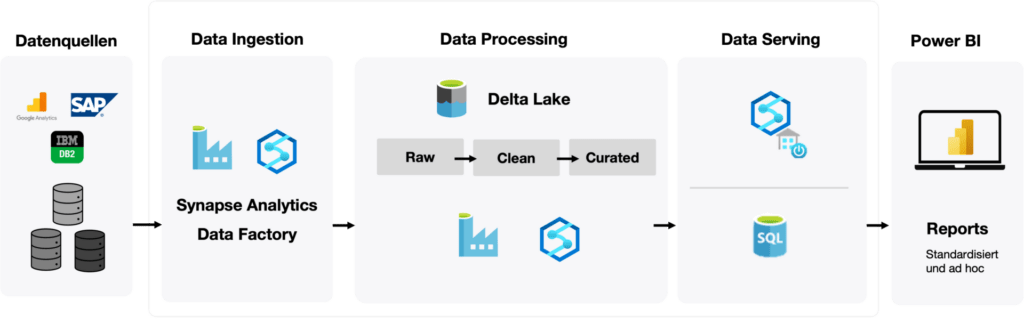
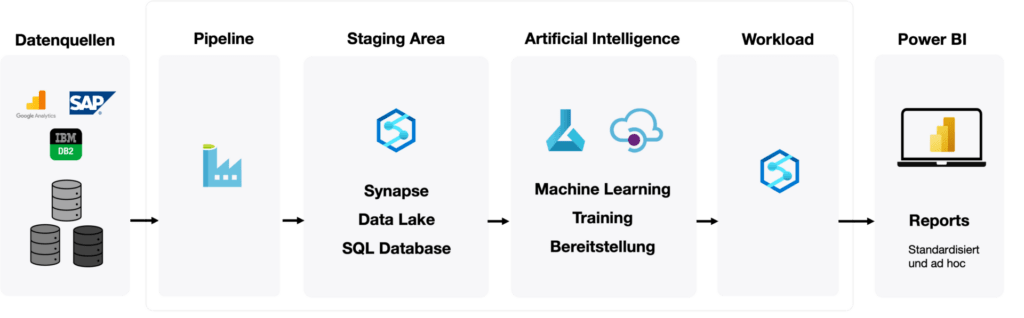
State-of-the-art BI and analysis tools help us and our customers to optimize and expand existing reporting. Here, in this example of one of our customer projects, we show how data was evaluated with one of our standardized BI and analysis tools and made available to users in various views. OUTPUT SITUATION We have the following situation with our [...]
HOTLINE STATISTICS
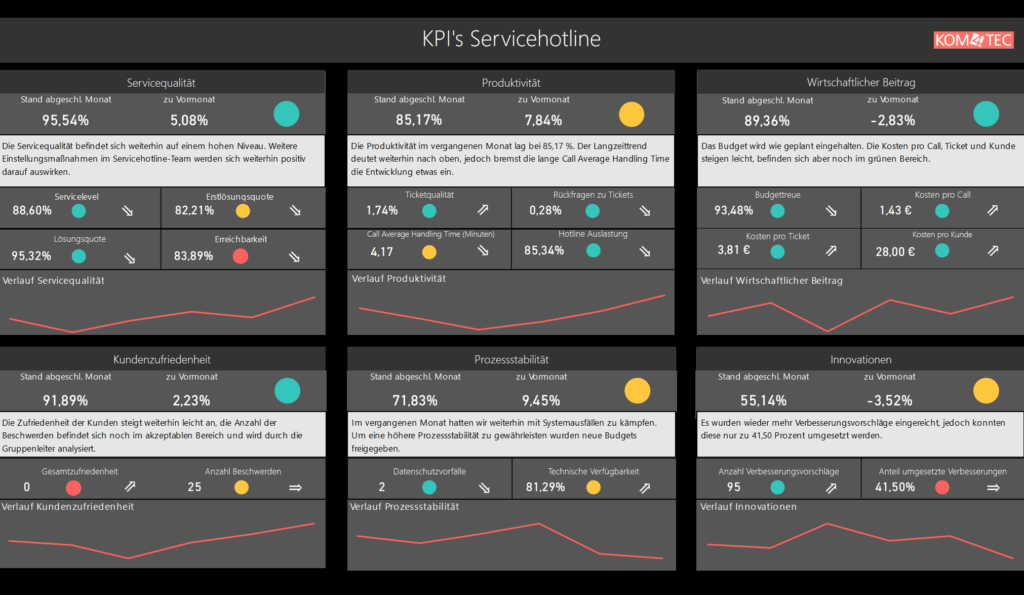
In the following example, one of our customers asked us to analyze their service hotline in order to evaluate its performance. For this purpose, relevant key figures were defined, data from various systems was queried and, of course, visualized with the help of state-of-the-art Power BI. The goal was to provide a detailed evaluation of the service hotline in a central location for our [...]
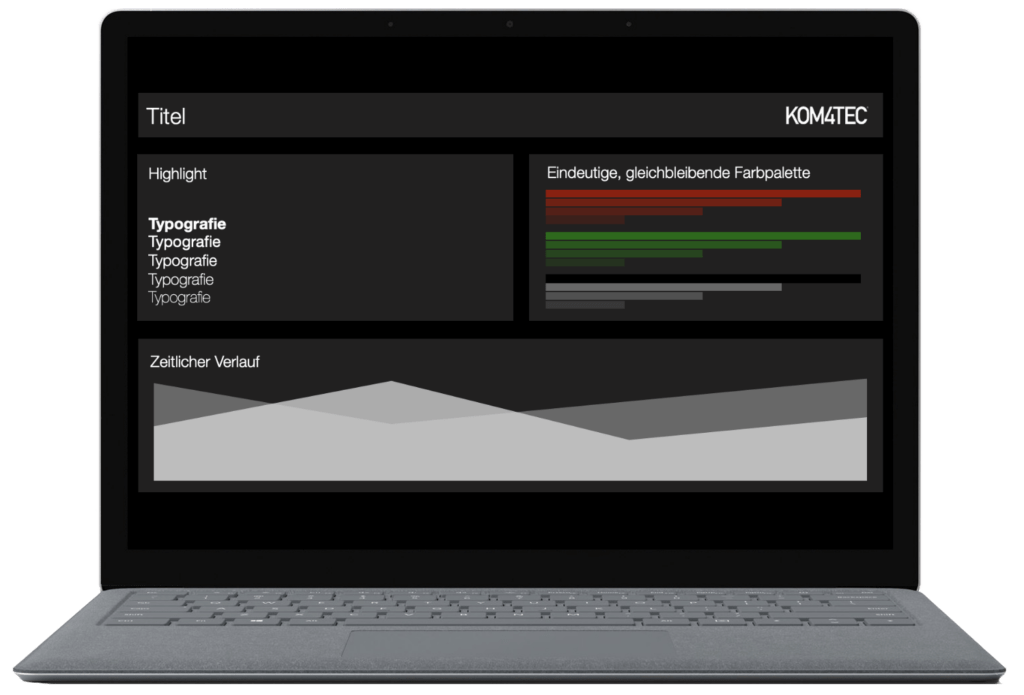
Clean.Business.Visual

In developing this visual, our focus was to create a visualization that draws attention to the essentials.
Easy to consume, yet meaningful and accurate.
With just three data fields, you can create multiple charts for your reporting needs.