OPTIMIZATION OF POWER BI REPORTS

INITIAL SITUATION

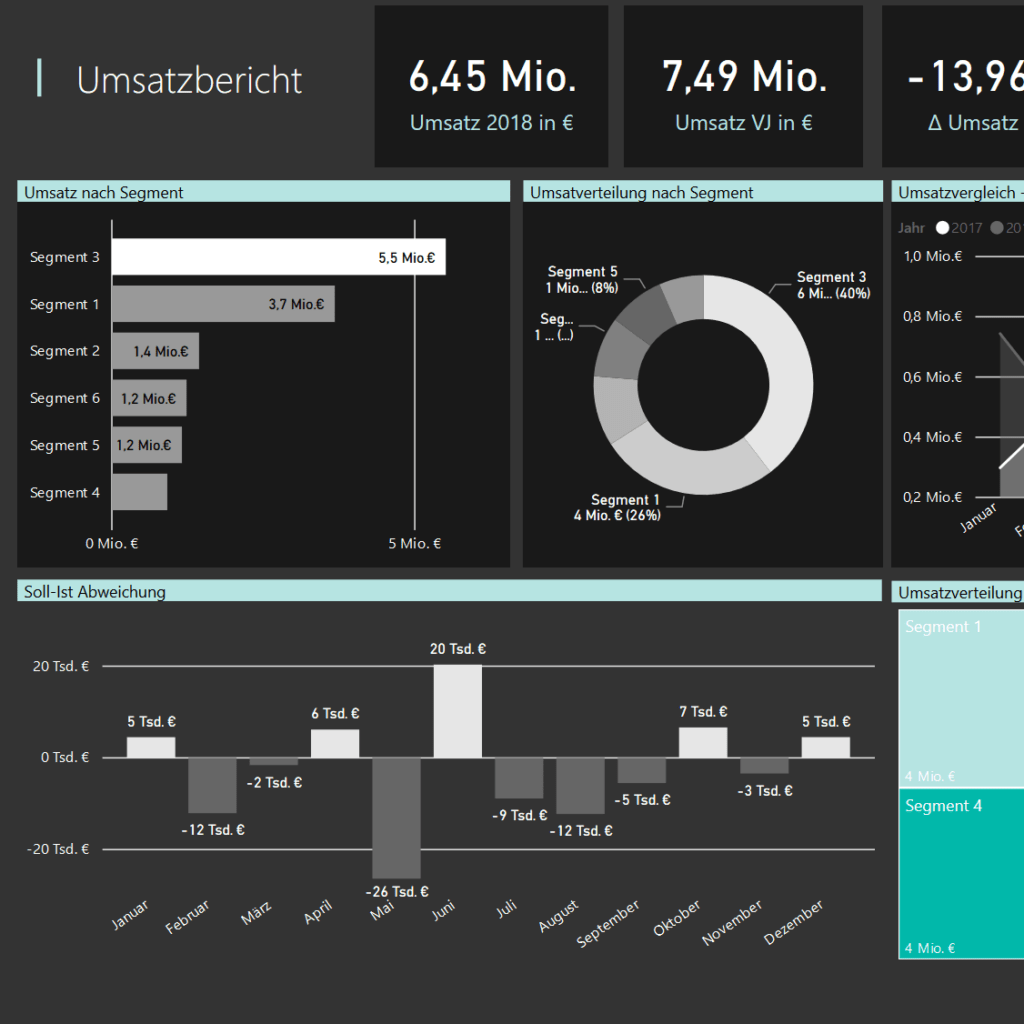
We recently had another assignment with a Power BI customer from the logistics industry. The customer uses Power BI to create various reports in controlling and in the area of logistics itself and approached us with the desire to further optimize and sharpen existing reports (logistical evaluations such as warehouse movements). The challenge was to meet the customer's requirements sufficiently and to extend the logistical evaluations with individual calculations.

IMPLEMENTATION

In a short preparation meeting, we defined together with the customer how the reports should be improved and extended with our support. The main focus here was on various calculations that enable a better comparison of the warehouse movements on a temporal level. Another important point for the customer, the integration of the shift models of the different warehouse locations should also be implemented in the upcoming workshop.

POWER BI SUPPORT IN WORKSHOP FORMAT

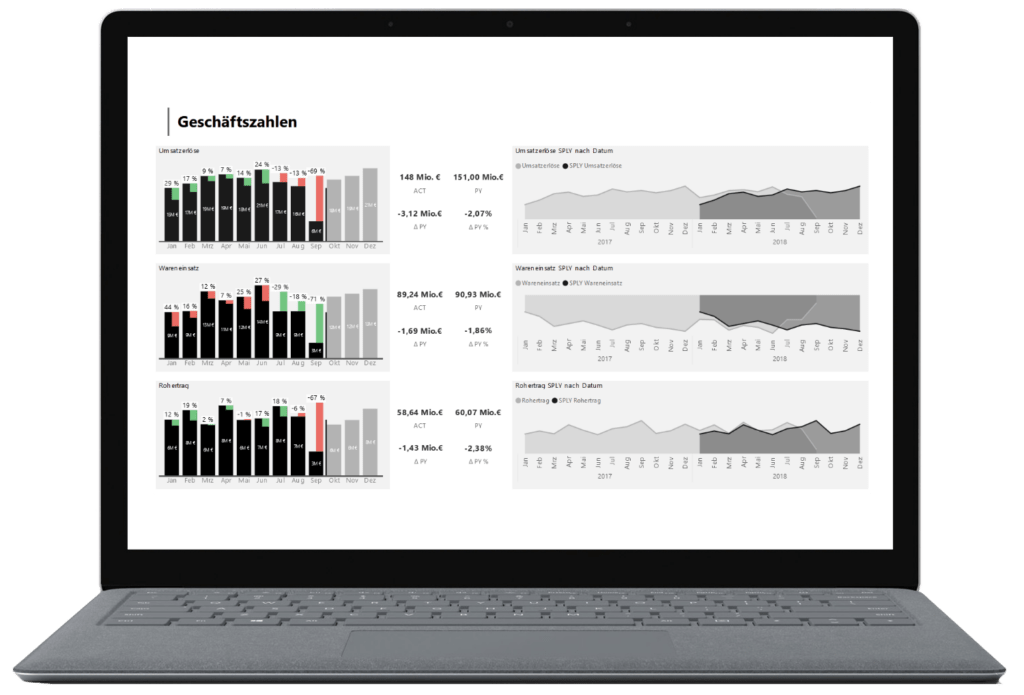
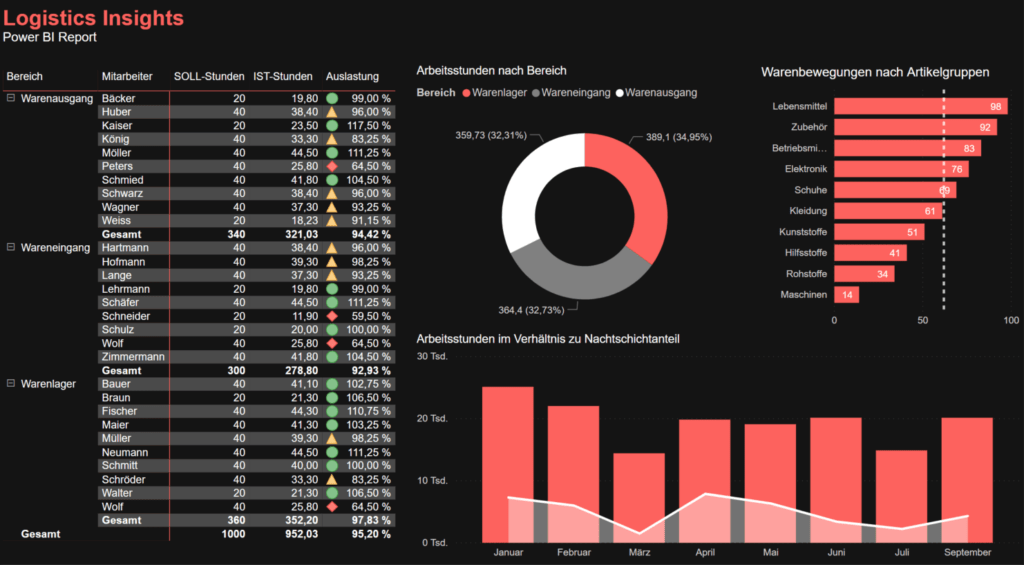
In the workshop, several calculations could then be integrated within approx. 4 hours, which enable the comparability of the analyzed stock movements on a weekly and monthly level. Among other things, these were visualized in the form of absolute values as so-called KPI tiles. The desired layer model could also be implemented. The shifts can now be maintained manually and assigned to the individual stock movements via the respective location ID. Thus, it can be determined in which layer the respective booking was made.

Furthermore, the workload of the individual areas and employees was analyzed. This is done both in the form of a ring diagram and in the form of a matrix. The matrix clearly presents the information from the individual areas. In this case, the target and actual working hours of the individual employees are shown, and the utilization is calculated as a percentage.

CONCLUSION

In the workshop, the desired enhancement of the report was created together with the customer. In addition to the pure implementation, the workshop also served as a knowledge transfer between us as a service provider and the customer. A comparability of the analyzed stock movements on a weekly and monthly level was created for the customer and visualized in meaningful dashboards.

With the help of the detailed analysis, a more precise control as well as a better planning within the individual areas or shifts can take place. This naturally leads to better cost control and, ideally, to a reduction in costs and more efficient operation.

Design

According to your wishes we create report designs according to the latest information design and UX/UI standards.

Our goal is to enable optimal report usage with the appropriate story telling.

Kom4tec - BI Analytics - Implementation - Design - Laptop Mockup Design Report

Frontend

Our developers design customized reporting solutions.

Particular attention will be paid to the following:


Building Power BI Infrastructure

Create Power BI Reports

Workshops & Trainings

Kom4tec - BI Analytics - Implementation - Frontend - Laptop Mockup Business Figures

KPI's

With our broad expert knowledge in numerous business areas, we offer you holistic support in the development of key figures

Distribution

Retail, Wholesale, E-Commerce.

Controlling + Finance

Accounting, sales controlling, investment controlling.

Supply Chain Management

Logistics, purchasing, production.

Marketing

Websites, email marketing, social media campaigns.

Together with you, we define the necessary key figures and KPIs.

Backend

Unsere Data Engineering Experten generieren die richtige Kulisse für dein Reporting.

Mit der Microsoft Produktpalette entwickeln wir Data Warehouses, Data Lakes und Data Lakehouses nach neusten Standards.

Dazu nutzen wir unter anderem:

Azure Data Factory

Azure Data Lake

Azure Data Bricks

Azure Synapse

Azure SQL

Kom4tec - Icon - Relief databases

SSIS, SSRS

KOM4TEC - Microsoft Fabric Logo

Microsoft Fabric

Central reporting

Single Point of Truth

For reporting, we create the basis for powerful data analyses.

At a glance

Create visualizations that draw attention to the essentials.

Clear

Easy to consume yet meaningful and accurate.

Customized design

According to the latest design standards and corporate identity guidelines - On all devices!

Enterprise Reporting & Self Service

One place

Meet your self-service BI and enterprise data analytics needs on a single platform.

Share

Create & share reports, apps and data models. Relieve IT resources with true self-service.

Gartner Magic Quadrant

Microsoft is ranked as a Leader in the March 2022 Gartner® Magic Quadrant™ for Analytics and Business Intelligence Platforms for the second year in a row

Data management

Your data management in an individual data warehouse, based on the Microsoft SQL engine. With Azure Data Factory, Azure Data Lake Storage and Microsoft SQL Servers, Microsoft provides a comprehensive modern data warehouse solution for companies of all sizes, whether in the cloud or on-premises. 

Benefit from established techniques like SSIS and SSAS and leverage cutting-edge solutions like Azure AI & Machine Learning.

Efficient and centralized storage

Relief of the operational databases

Reduction of dependence on manual processes of data evaluation

Consistent database for reporting applications

Consolidation and aggregation of data

Creation of a single point of truth

Architektur

Kom4tec - BI Analytics - Backend - Architektur

Azure Data Lakehouse

Azure Machine Learning Architektur

Kom4tec - BI Analytics - Backend - Azure Machine Learning Architektur

Microsoft Fabric

Data sources

Beispiele für Power BI Datenquellen

Kom4tec - Azure Logo - BI Analytics Data Sources

Azure

Kom4tec - Microsoft Excel Logo - BI Analytics Data Sources

Excel

Kom4tec - Salesforce Logo - BI Analytics Data Sources

salesforce

Kom4tec - Google Analytics Logo - BI Analytics Data Sources

Google Analytics

Kom4tec - SAP Logo - BI Analytics Data Sources

SAP

Kom4tec - adobe analytics Logo - BI Analytics Data Sources

Adobe Analytics

Kom4tec - Asana Logo - BI Analytics Data Sources

Asana

Kom4tec - github Logo - BI Analytics Data Sources

Github

Kom4tec - IBM Logo - BI Analytics Data Sources.png

IBM DB2

Data sources

Beispiele für Power BI Datenquellen

Kom4tec - Azure Logo - BI Analytics Data Sources

Azure

Kom4tec - Microsoft Excel Logo - BI Analytics Data Sources

Excel

Kom4tec - Salesforce Logo - BI Analytics Data Sources

salesforce

Kom4tec - Google Analytics Logo - BI Analytics Data Sources

Google Analytics​

Kom4tec - SAP Logo - BI Analytics Data Sources

SAP

Kom4tec - adobe analytics Logo - BI Analytics Data Sources

Adobe Analytics

Kom4tec - Asana Logo - BI Analytics Data Sources

asana

Kom4tec - github Logo - BI Analytics Data Sources

Github

Kom4tec - IBM Logo - BI Analytics Data Sources.png

IBM DB2