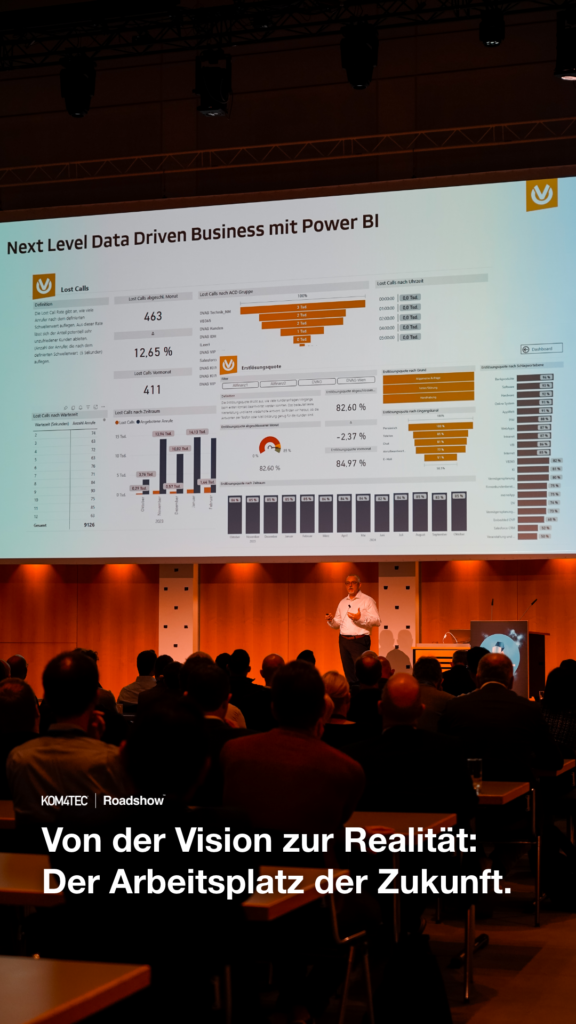
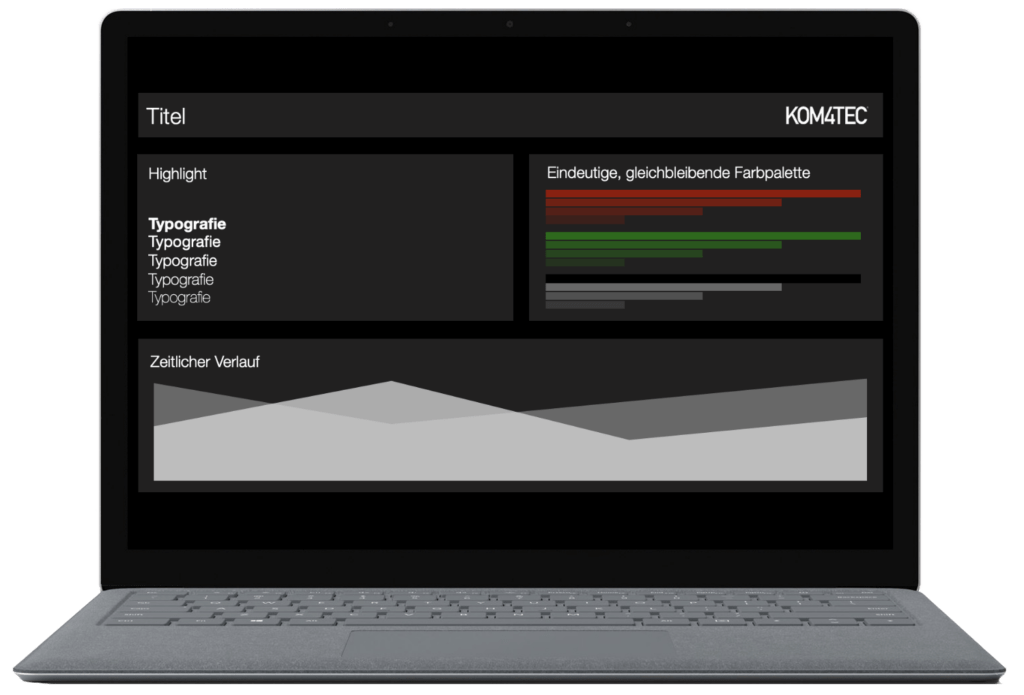
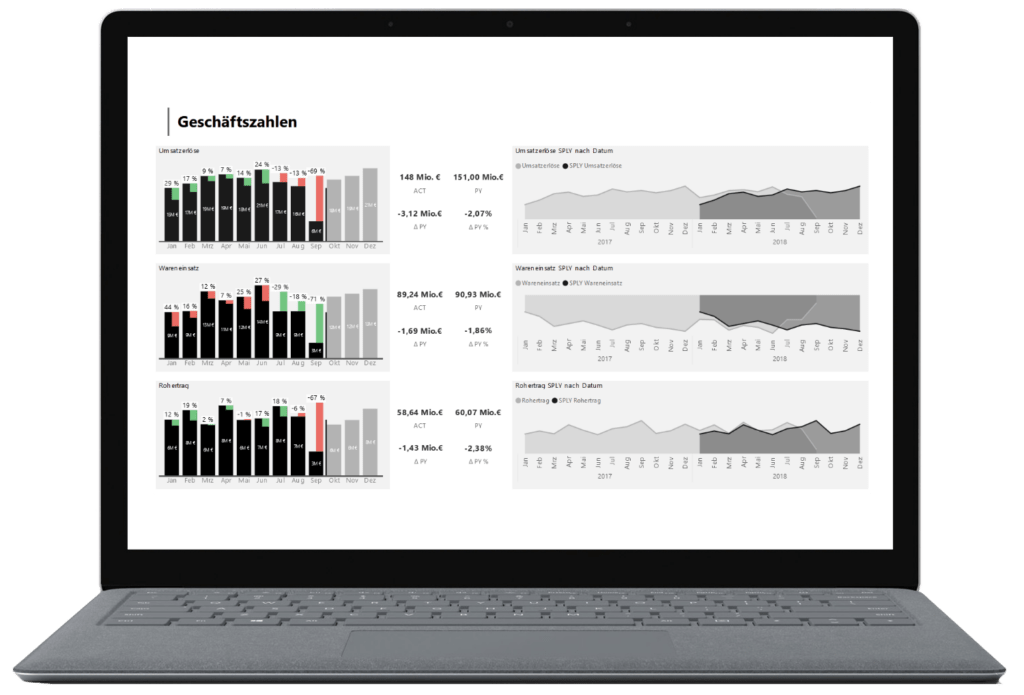
Microsoft Power BI for success with the Data Driven Company
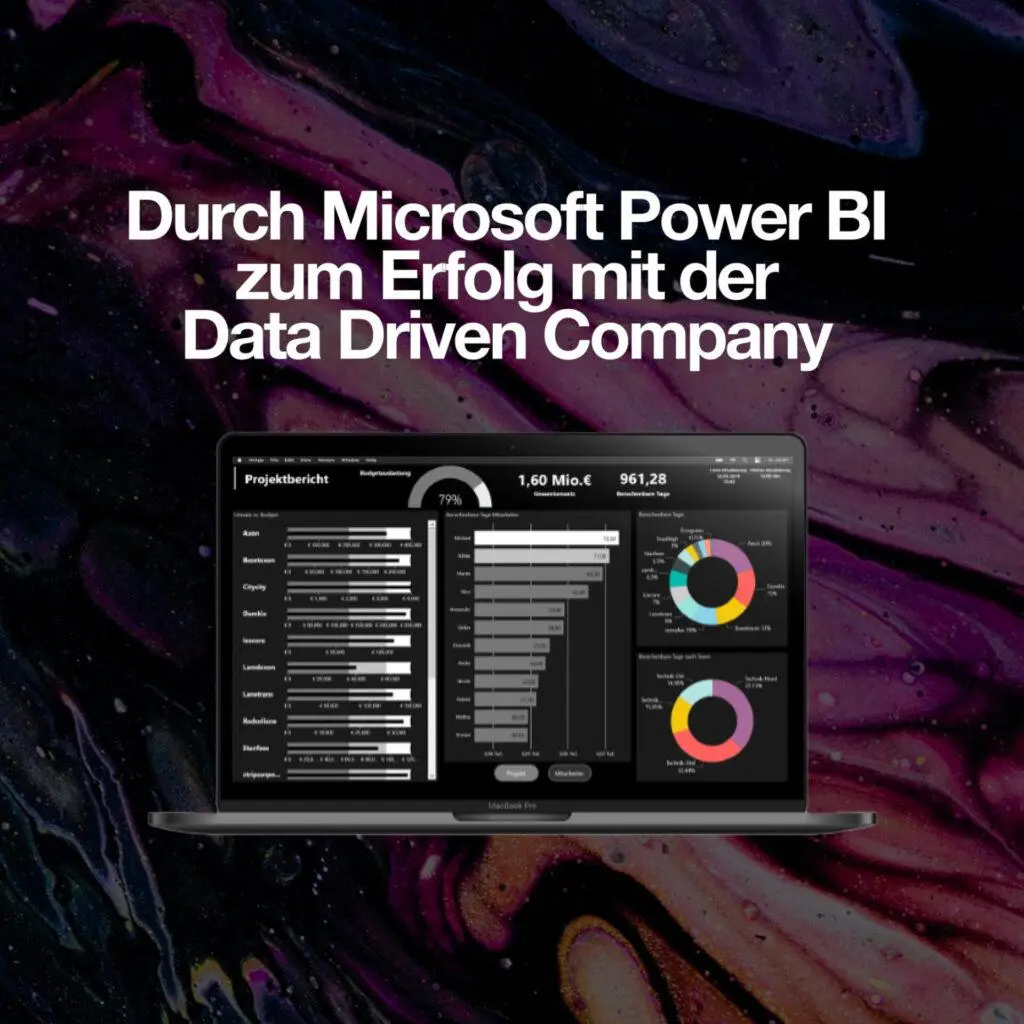
Become a data-driven company with Microsoft Power BI and shape your business strategy on the basis of sound data.
KOM4TEC Finance Reporting Suite 🙌🏼
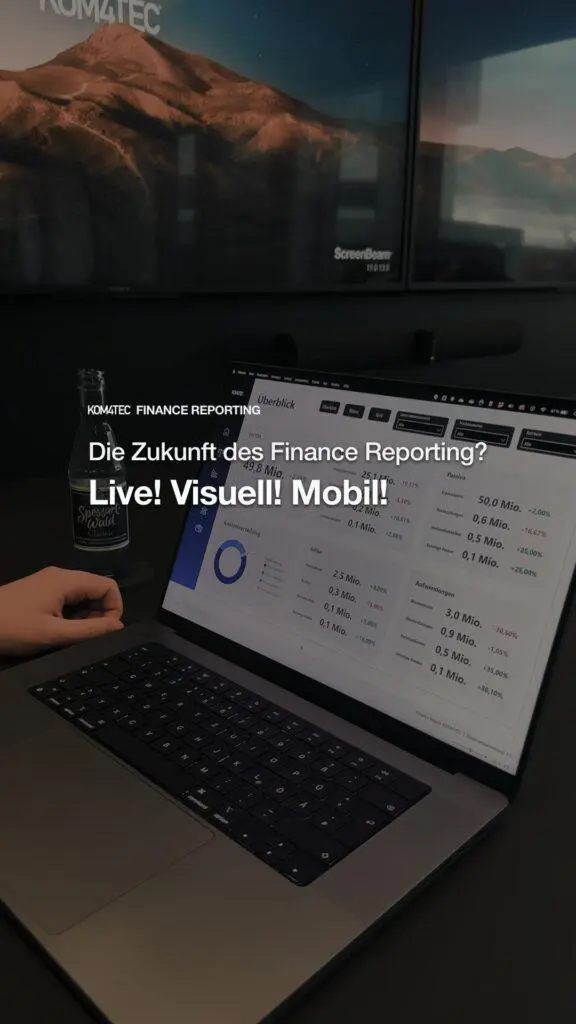
Presentation of our new Finance Reporting Suite.
#32 New Work. New Analytics.
With SUCCES to IBCS - How do I take the reporting standard to the next level?
Power BI Quick Tip - Power Point
Today I will introduce you to one of the new Power BI features. In this video, you'll learn how you can use the Power BI add-in to improve your presentation and enhance its content.
Power BI Quick Tip - SharePoint

In this video, we will show you how to use a simple trick to make your SharePoint query even more efficient and improve query times on documents and data.
Power BI Quick Tip - Measures and Quickmeasures
Welcome to this Power BI Quicktip video.In this video, we want to help you get started with Power BI Measures and Quickmeasures and show you how you can add value to your reports using these calculations.
Social Media Report

We start the video series with the Social Media Marketing Report, presented by Alexander Kaiser, Consultant BI/Analytics. You will get exciting insights into the application area and the possible uses of the report!
Power BI Quick Tip - ABC Analysis
Welcome to this Power BI quick tip video.
In this video you will learn how to create an ABC analysis with the help of Power BI Measures and how to visualize it afterwards.
KOM4TEC on Tour - Santa Barbara Part 2

And thus the resolution of what exactly Benedikt Bruns and Micheal Thierolf have implemented in California 🎙
On the agenda was the recording of the Microsoft video course "Managing Data with Microsoft 365" at Madecraft 💯
KOM4TEC on Tour - Santa Barbara Part 1
This time, it was almost 12 hours by plane to the Sunshine State - not (just) for fun, of course.
In the next video, you can find out which exciting project Benedikt Bruns and Michael Thierolf were able to implement on site 😉.