Clean.Business.Visual

In developing this visual, our focus was to create a visualization that draws attention to the essentials. Easy to consume, yet meaningful and accurate. With just three data fields, you can create multiple charts for your reporting needs.

What is Clean.Business.Visual?

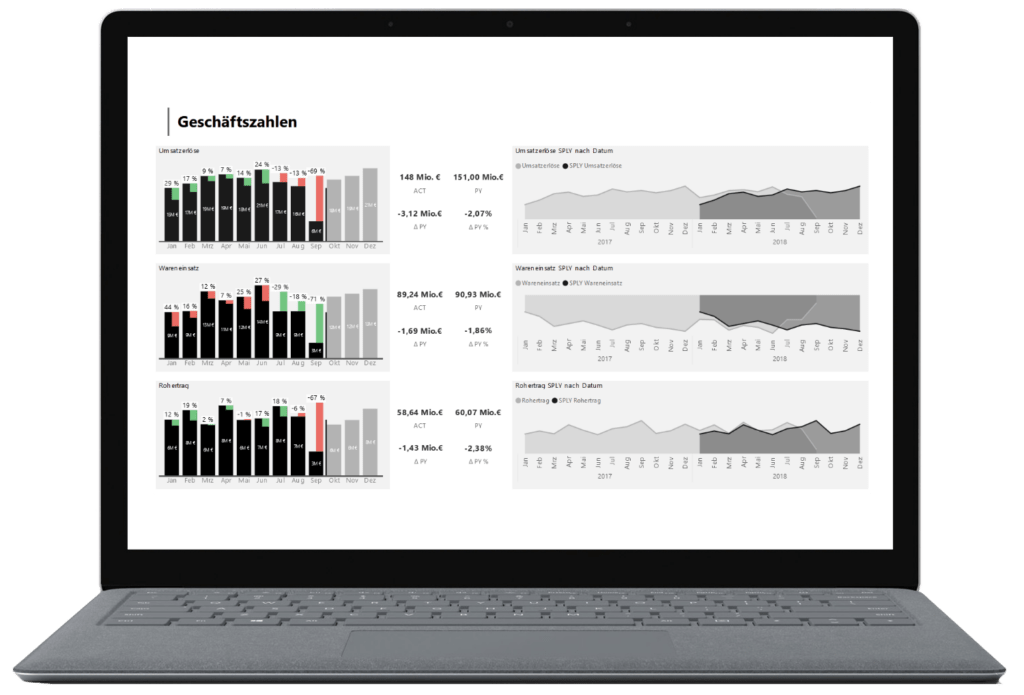
The visual offers you four professional business charts for Power BI in one solution. Create meaningful charts for your reporting needs with only a maximum of three data fields.

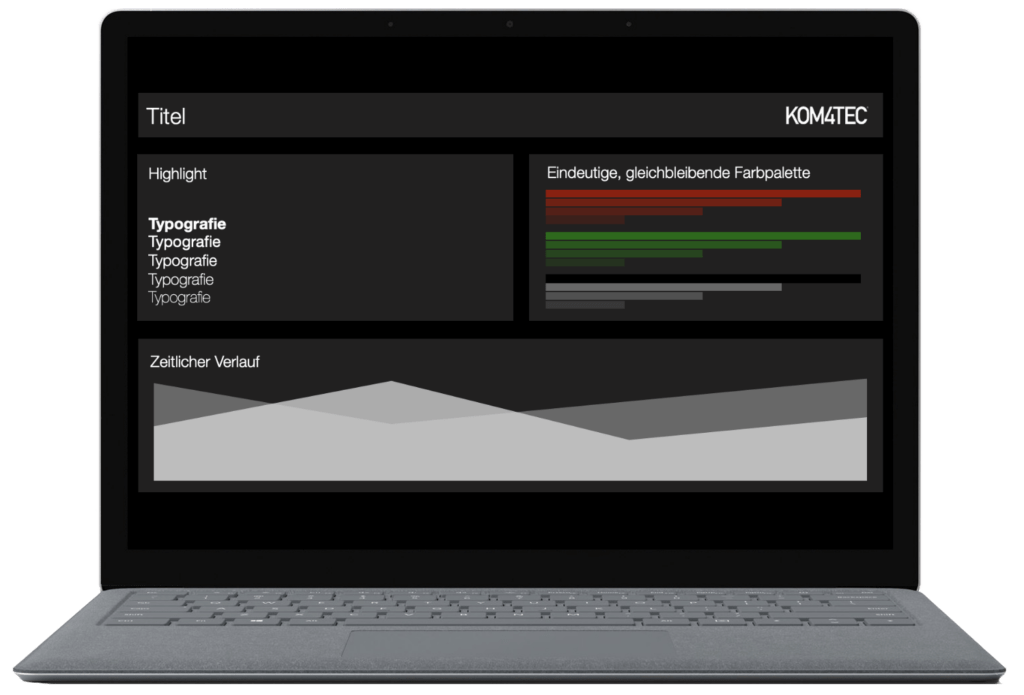
When creating the Clean.Business.Visual, we placed particular emphasis on what is known as information design. The goal of information design is to present information in such a way that it can be used efficiently and effectively.

This means our visuals are programmed to convey information in the best possible way.
Data names, colors and fonts can be formatted to establish a consistent corporate design.

New diagrams

With Visual for Power BI, you can easily add newly designed charts and customize them with many options.

As an upgrade to the standard visualizations, this visual offers you several application options at once. Simply select the visualization you need and adapt the diagram according to the situation.

Included in the visual

Design your income statements or profit and loss statements with the following chart types:

- Deviation chart with integrated, percentage deviation
- Deviation chart relative
- Deviation chart absolute
- Grouped bar chart with axis overlap
- Multiple charts in one graphic are possible

Design

Nach Ihren Wünschen erstellen wir Report Designs nach neusten Information- Design- und UX/UI- Standards.

Unser Ziel ist es mit dem passenden Story Telling eine optimale Berichtsnutzung zu ermöglichen.

Kom4tec - BI Analytics - Umsetzung - Design - Laptop Mockup Design Report

Frontend

Unsere Entwickler entwerfen maßgeschneiderte Reporting-Lösungen.

Besonderes Augenmerk gilt dabei folgenden Punkten:


Aufbau Power BI Infrastruktur

Erstellen von Power BI Reports

Workshops & Trainings

Kom4tec - BI Analytics - Umsetzung - Frontend - Laptop Mockup Geschäftszahlen

KPI's

Mit unserem breiten Expertenwissen in zahlreichen  Geschäftsbereichen bieten wir Ihnen ganzheitliche Unterstützung bei der Entwicklung von Kennzahlen

Vertrieb

Retail, Wholesale, E-Commerce.

Controlling + Finance

Buchhaltung, Vertriebscontrolling, Beteiligungscontrolling.

Supply Chain Management

Logistik, Einkauf, Produktion.

Marketing

Websites, Email-Marketing, Social Media Kampagnen.

Wir definieren gemeinsam mit Ihnen die notwendigen Kennzahlen und KPI’s.

Backend

Our SQL experts generate the right backdrop for your reporting.

With the Microsoft Azure product range, we develop data warehouses according to the latest standards.

Among other things, we use for this purpose:

Azure Data Factory

Azure Data Lake

Azure Data Bricks

Azure Synapse

Azure SQL

Kom4tec - Icon - Relief databases

SSIS, SSRS

Central reporting

With Power BI as the 'single point of truth' for reporting, we create the basis for powerful data analysis.

Create visualizations that draw attention to the essentials.

Easy to consume yet meaningful and accurate.

According to the latest design standards and corporate identity guidelines - On all devices!

Single Point of Truth

For reporting, we create the basis for powerful data analyses.

At a glance

Create visualizations that draw attention to the essentials.

Clear

Easy to consume yet meaningful and accurate.

Customized design

According to the latest design standards and corporate identity guidelines - On all devices!

Enterprise Reporting & Self Service

One place

Meet your self-service BI and enterprise data analytics needs on a single platform.

Share

Create & share reports, apps and data models. Relieve IT resources with true self-service.

Gartner Magic Quadrant

Microsoft is ranked as a Leader in the March 2022 Gartner® Magic Quadrant™ for Analytics and Business Intelligence Platforms for the second year in a row

Datenquellen

weiteren Text… Beispiele für Power BI Datenquellen

Kom4tec - Azure Logo - BI Analytics Datenquellen

Azure

Kom4tec - Microsoft Excel Logo - BI Analytics Datenquellen

Excel

Kom4tec - Salesforce Logo - BI Analytics Datenquellen

salesforce

Kom4tec - Google Analytics Logo - BI Analytics Datenquellen

Google Analytics

Kom4tec - SAP Logo - BI Analytics Datenquellen

SAP

Kom4tec - adobe analytics Logo - BI Analytics Datenquellen

Adobe Analytics

Kom4tec - Asana Logo - BI Analytics Datenquellen

Asana

Kom4tec - github Logo - BI Analytics Datenquellen

Github

Kom4tec - IBM Logo - BI Analytics Datenquellen.png

IBM DB2

Data management

Your data management in an individual data warehouse, based on the Microsoft SQL engine. With Azure Data Factory, Azure Data Lake Storage and Microsoft SQL Servers, Microsoft provides a comprehensive modern data warehouse solution for companies of all sizes, whether in the cloud or on-premises. 

Benefit from established techniques like SSIS and SSAS and leverage cutting-edge solutions like Azure AI & Machine Learning.

Efficient and centralized storage

Relief of the operational databases

Reduction of dependence on manual processes of data evaluation

Consistent database for reporting applications

Consolidation and aggregation of data

Creation of a single point of truth