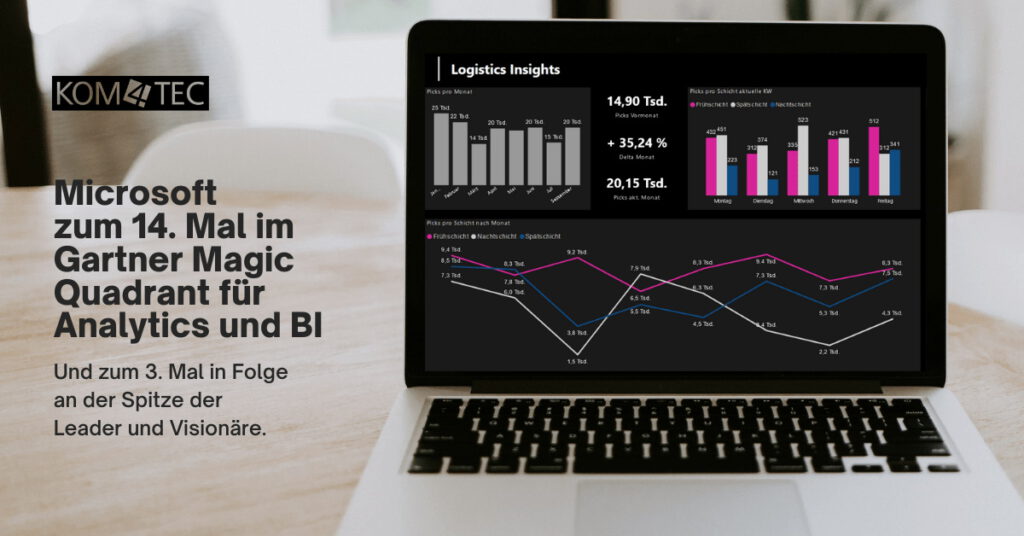
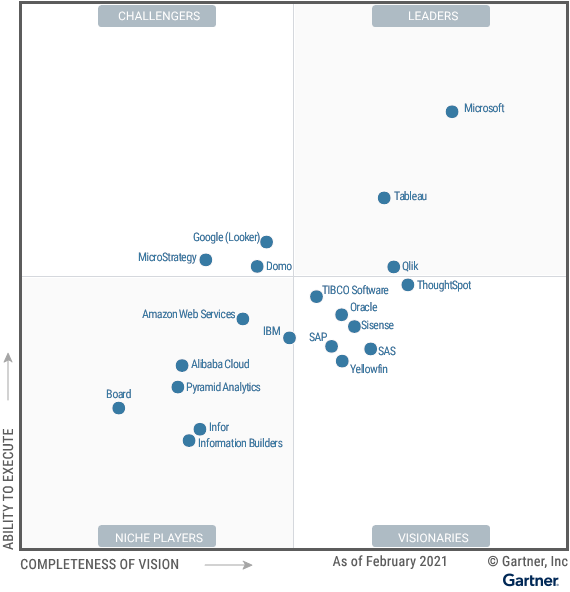
Microsoft Power BI - ranked 14th in the Gartner Magic Quadrant for Analytics and BI
... and for the third time in a row at the far right of the quadrant. That is, at the top of the leaders and visionaries. Microsoft has massive market reach through Microsoft Office and a comprehensive and visionary product roadmap.
Microsoft Power BI has helped more than 250,000 companies - including 97 percent of the Fortune 500 - build their data culture.
THIS IS WHAT GARTNER SAYS ABOUT MICROSOFT POWER BI:
- Microsoft offers data preparation, visual-based data discovery, interactive dashboards and augmented analytics in Power BI. This is available as a SaaS option running in the Azure cloud or as an on-premises option in Power BI Report Server. The Power BI Desktop App can be used as a standalone, free personal analytics tool.
- Microsoft is releasing a weekly update to its cloud-based Power BI service, with hundreds of features added in 2020. Notable additions include more augmented analytics in the form of AI-infused experiences, including Smart Narratives (NLG) and anomaly detection capabilities for out-of-the-box visualizations. .
- Power BI's increasing integration with Microsoft Teams, with its tens of millions of daily active users, will further extend its reach into the world of remote work. Power BI is now often the option organizations have in mind when using Gartner's customer query to select the ABI platform - "why not Power BI?" is effectively the question most are asking.
- Price/performance is right. The Power BI cloud service is extremely rich in its features, which include an expanded set of augmented analytics and automated ML capabilities. AI-powered services such as text, sentiment and image analytics are available in Power BI Premium and draw on Azure capabilities.
- Microsoft continues to invest in a broad set of visionary capabilities and integrate them into Power BI. It says 80,000 customers are now using AI services in Power BI implementations. Microsoft continues to promote its use at scale, for example, by applying ML-driven, automated optimization of materialized views on Azure Synapse (and soon other data sources, including Snowflake and Redshift) to automatically optimize query performance.
THAT'S WHY COMPANIES CHOOSE POWER BI
1. Power BI Insights, Office 365 Productivity - integrated with Excel and Microsoft Teams.
2. with Power Query, you can access data anywhere with hundreds of built-in connectors.
3. rapidly create intelligent systems with Power BI + Microsoft Azure Synapse Analytics.
4. linking with the Microsoft Power Platform - from insights to implementation.
5. only BI product with integrated data loss prevention through Microsoft Information Protection and Microsoft Cloud App Security.
6. industry-leading AI that helps find answers quickly.
7. the Power BI Mobile App.
8. cloud maturity - among one of the largest and fastest growing BI clouds.
9. rapid, user-driven innovation - new features are released weekly based on user feedback.
10. promoting a data culture with access for all.
WHAT'S BEHIND THE GARTNER MAGIC QUADRANT FOR ANALYTICS AND BUSINESS INTELLIGENCE PLATFORMS?
Analytics and business intelligence (ABI) platforms feature easy-to-use capabilities that support a complete analytic workflow - from data preparation to visual exploration and insight generation - with an emphasis on self-service and advanced user support.
Vendors in the ABI market range from startups backed by venture capital funds to large technology companies. In many cases, ABI platforms are entry points for broader sets of cloud data management capabilities offered by cloud providers, such as Microsoft.
ABI platforms are no longer differentiated solely by their data visualization capabilities, which are now standard. All vendors can create interactive key performance indicator (KPI) dashboards that use common chart shapes (bar/column, line/area, scatter, pie, and geographic maps) and draw on a wide range of data sources. Differentiation has shifted to how well platforms offer augmented analytics options. These "augmented analytics" use machine learning (ML) and artificial intelligence (AI) to prepare data, generate insights, and explain them. They help users explore and analyze data more effectively than would be possible with manual effort.
This Magic Quadrant evaluates vendor capabilities based on their 2020 implementation and future development plans. As vendors and the market evolve, the ratings may only be valid for a specific point in time.
Sources:
GartnerReprint