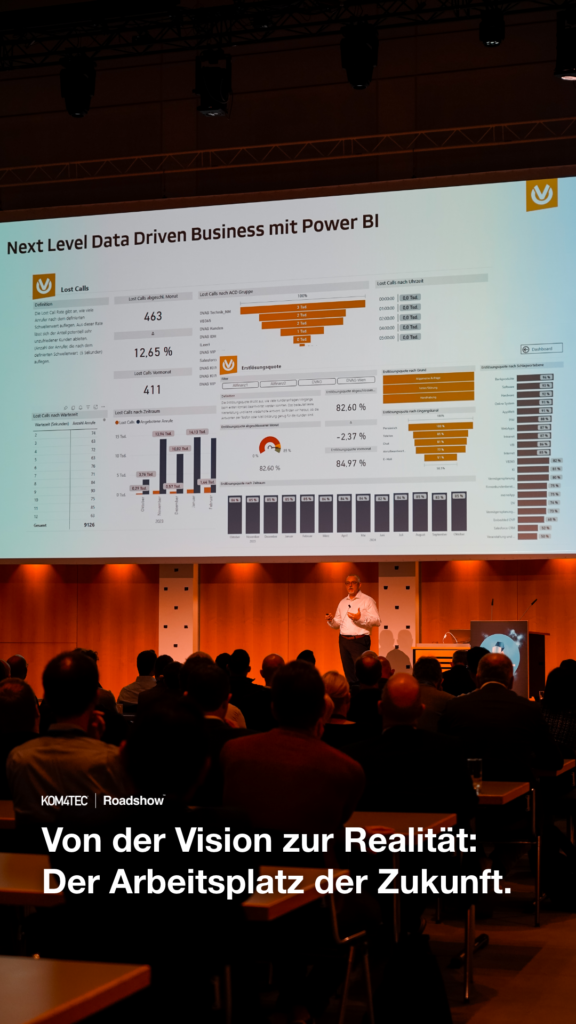
State-of-the-art BI and analysis tools help us and our customers to optimize and expand existing reporting. Here, in this example of one of our customer projects, we show how data was evaluated with one of our standardized BI and analysis tools and made available to users in various views.
INITIAL SITUATION
We found the following situation at our customer. Due to different data sources and large amounts of data, reporting was only possible with a great deal of effort. The data had to be obtained from the individual data sources with manual queries and processed in Excel. Each of our customer's employees created their own reports. There was no standardized process for report creation, which also led to a high susceptibility to errors. Distribution was done laboriously by e-mail. So it was high time for a change.
IMPLEMENTATION
By evaluating the data via Power BI, the sales can be evaluated via the feedback from the employees. Furthermore, budgets of the individual orders can be monitored and sales forecasts (target-actual) can be displayed.
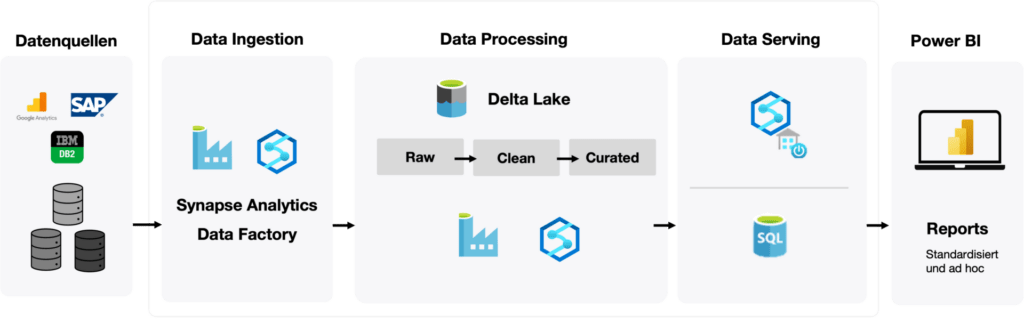
The data sources were connected to Power BI and transformed, then an automatic update was set up. The applied steps are saved by Power BI and applied automatically with each data update (no manual intervention required). This also standardized the key figure calculation. The distribution is done through the Power BI service, thus the reports are always available on desktop, tablet or smartphone.
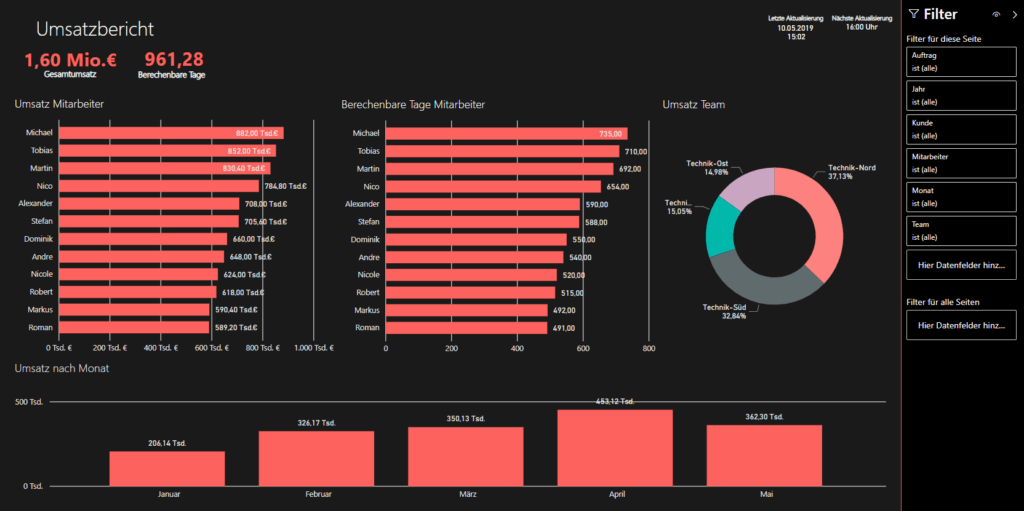
IMPLEMENTATION REPORT
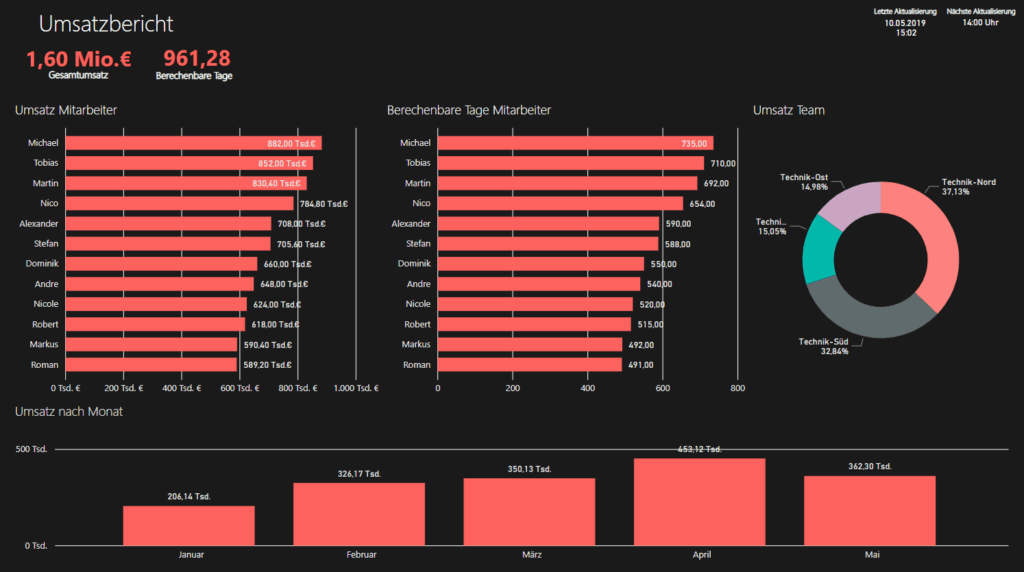
This page provides, an overview of the sales at team and employee level. The performance records recorded by the employees (in hours) are converted into days and displayed by the table calculation function in Power BI. A daily rate is assigned to the employee for each job, which can be used to calculate the revenue per employee. By assigning the employees to a department, the turnover can also be assigned to them. With the "drill-down" function, the turnover of the individual employees can be analyzed down to customer and order level.
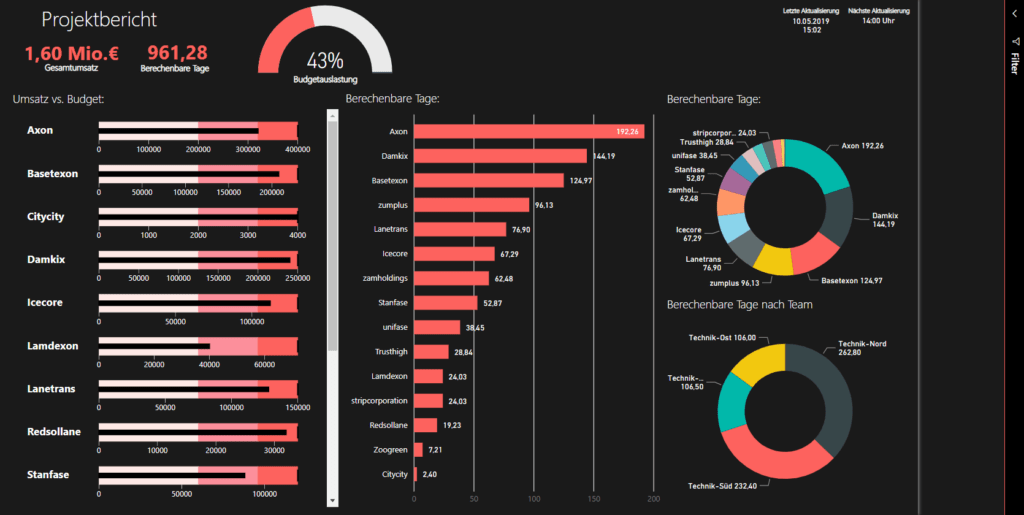
PROJECT REPORT
Linked to an order master table, recorded performance records are compared with the order volumes and the budget utilization is calculated. The report provides an overview of sales by customer and project. A notification on the smartphone is also activated if a budget is exceeded. The following can be seen from the two ring diagrams:
- Calculable days by customer/order group
- Predictable days by team
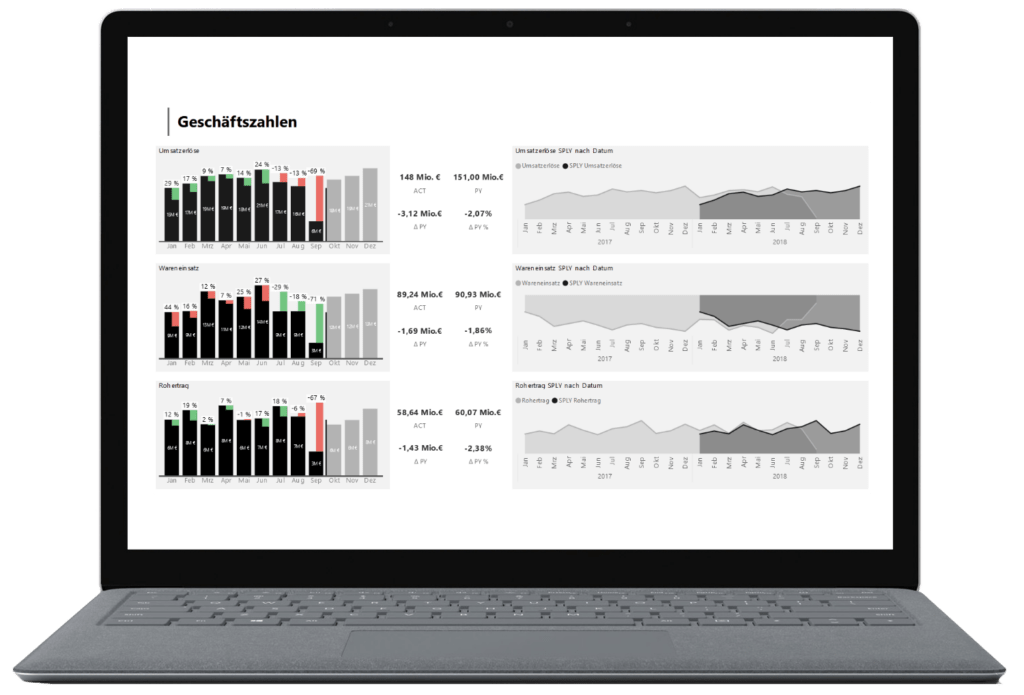
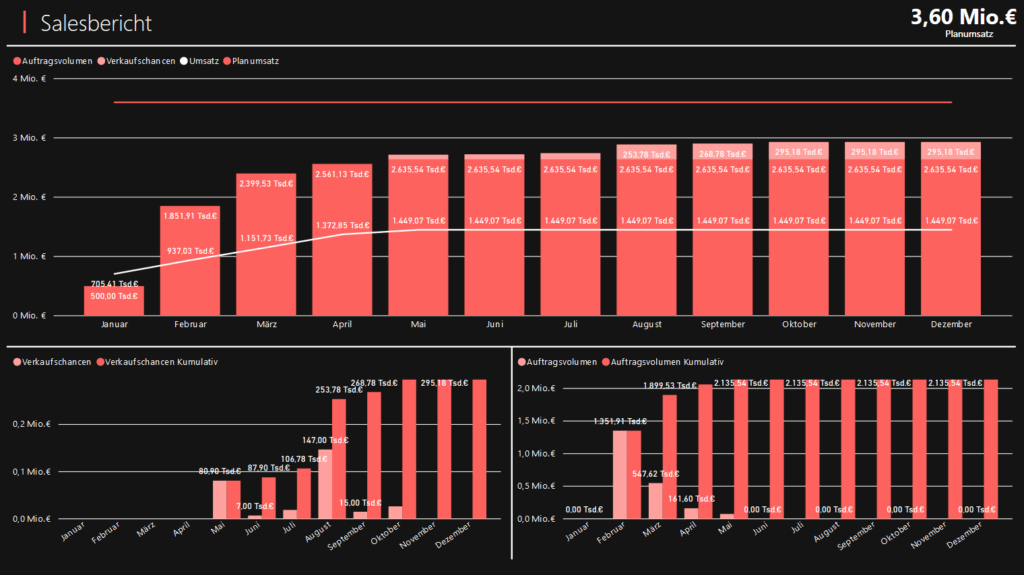
SALES REPORT
In the sales report, the order volume of existing orders together with the sales opportunities from CRM (Microsoft Dynamics) are compared with the current sales and the planned sales.
The values are presented cumulatively by month in order to calculate the planned sales by the end of the year. This forms an important decision-making basis for measures to achieve sales targets.
FILTER ROW
Power BI offers a collapsible filter bar in which various filter options can be defined. This bar offers the advantage that filters no longer have to be included in the reports, leaving more space for important visualizations.
The values are presented cumulatively by month in order to calculate the planned sales by the end of the year. This forms an important decision-making basis for measures to achieve sales targets.
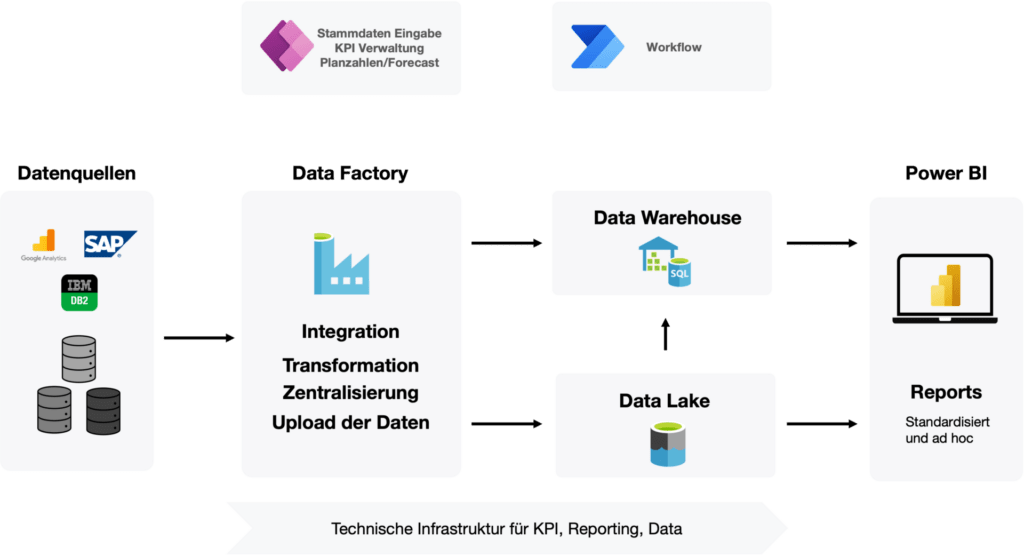
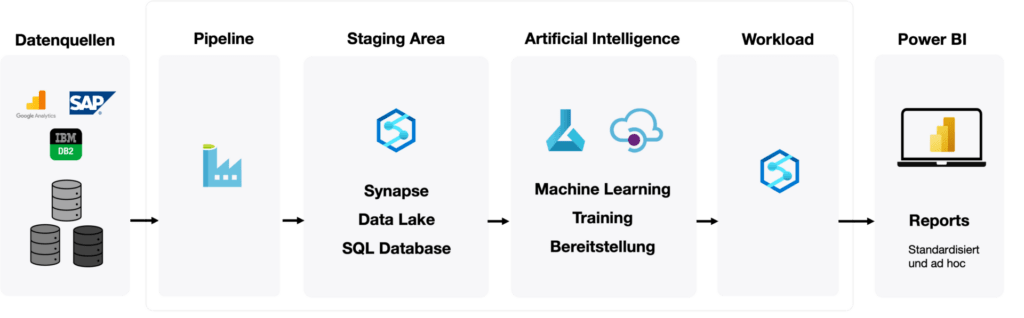
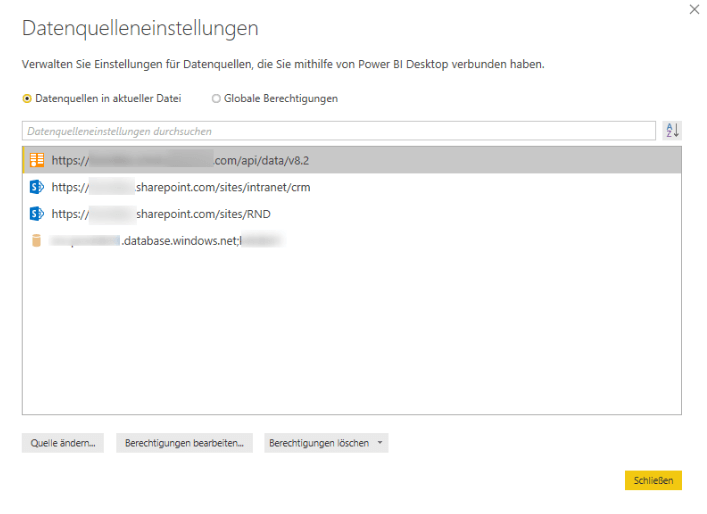
CONNECTORS & DATA SOURCES
The report is based on different data sources. Invoices and the customer base are connected from SharePoint. Service records, on the other hand, are retrieved from an Azure SQL database and data from the CRM system (Microsoft Dynamics) comes from an O-Data connection.
The values are presented cumulatively by month in order to calculate the planned sales by the end of the year. This forms an important decision-making basis for measures to achieve sales targets.
CONCLUSION
By using the BI tools, we were able to provide our customer with a new reporting standard. Numerous processes were optimized and as a result new insights were gained by the customer from his key figures. In addition, the following advantages could be achieved:
Time savings: Automatic updating of reports eliminates the need for time-consuming manual interventions as in the past.
Cost savings: Since a uniform reporting system has been created, the costs for programs that are no longer needed are eliminated.
Standardization of reporting: A uniform reporting standard was created in terms of both content and design.
Availability: Reports are now available on all devices for all employees at all times.