
#117 Microsoft Fabric – First-hand update.
Classification, added value, and perspectives for decision-makers.

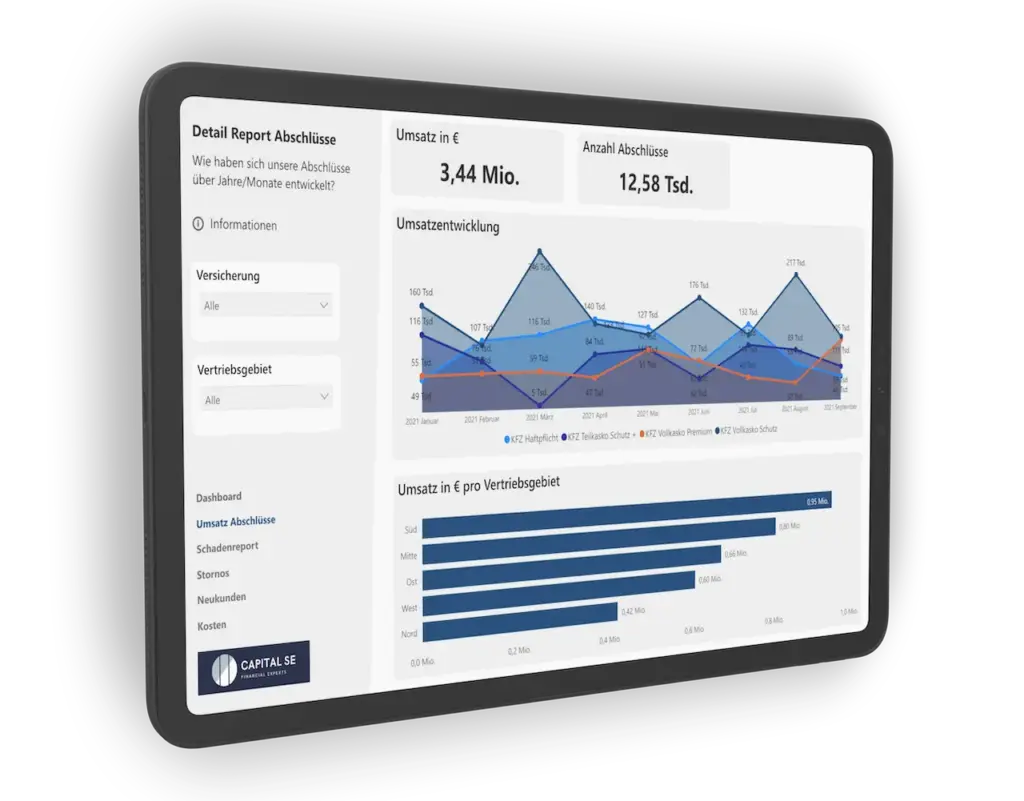
Case Study - SharePoint Online Capacity Reporting
Storage at a glance: How an insurance company proactively manages its SharePoint capacity.
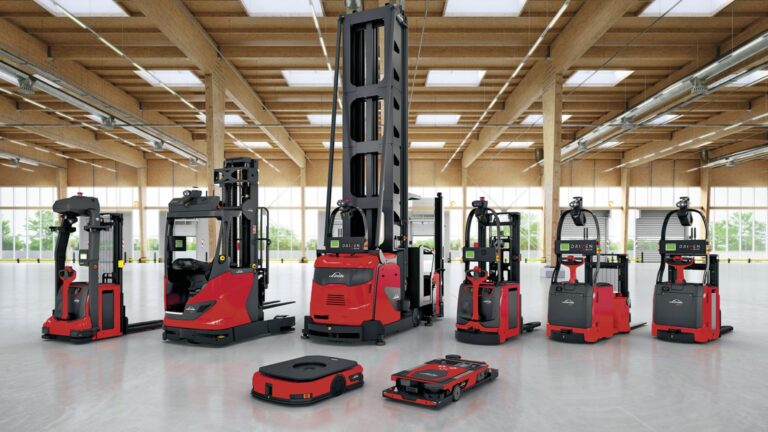
Case Study - Neotechnik
Introduction of Microsoft Fabric at Neotechnik: From requirements analysis, tool selection and licensing consulting to data integration, historicization and organization, we provided our customer with comprehensive support.

Case Study - DMARC Reporting
The misuse of a domain through spam or phishing worsens the reputation of a domain. DMARC reporting helps to identify and rectify security threats and the misuse of your own domain at an early stage. Automated reporting provides valuable insights into email delivery and avoids delivery problems due to DMARC errors.

Case Study - FC Moto
One of the largest online stores for motorcycle accessories introduces KPI reporting with Power BI.