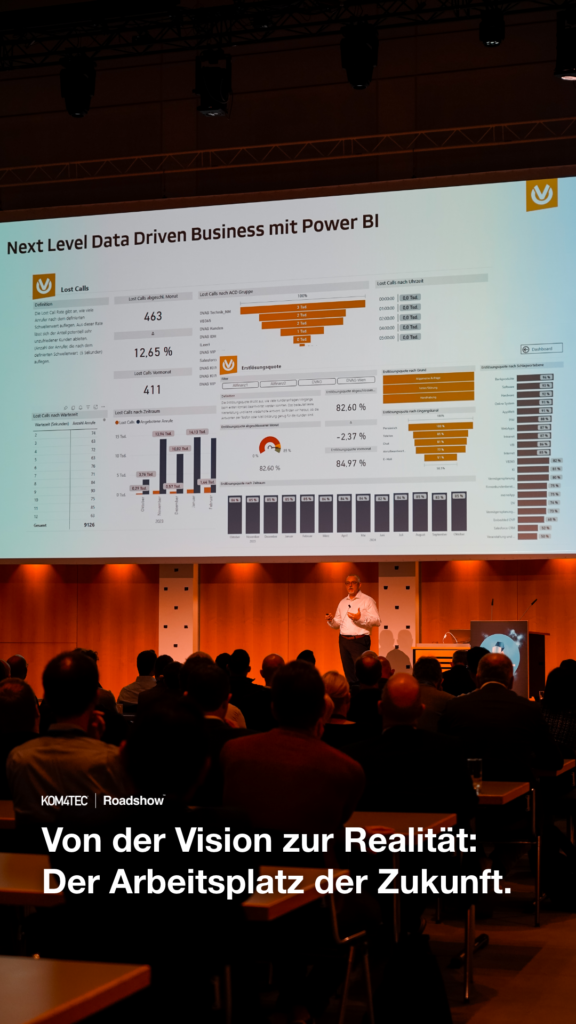
Management Cockpit - All relevant figures for me at a glance
Central and individual. One tool, many features.
With the use of Power BI as a central reporting tool in the company, more than just an evaluation can be generated. For example, management can be informed about deviations in certain key figures without having to actively work with Power BI.
A company has a wide variety of positions and management levels with correspondingly different KPI requirements.

With a specially created cockpit, dashboards can be created within Power BI in such a way that they contain only the information on key figures that are relevant for the respective user.
The highlight, with defined threshold values, Power BI automatically sends a data warning by e-mail if the defined values are undercut or exceeded.
From this situation, necessary measures can be initiated as quickly as possible and acted upon promptly.
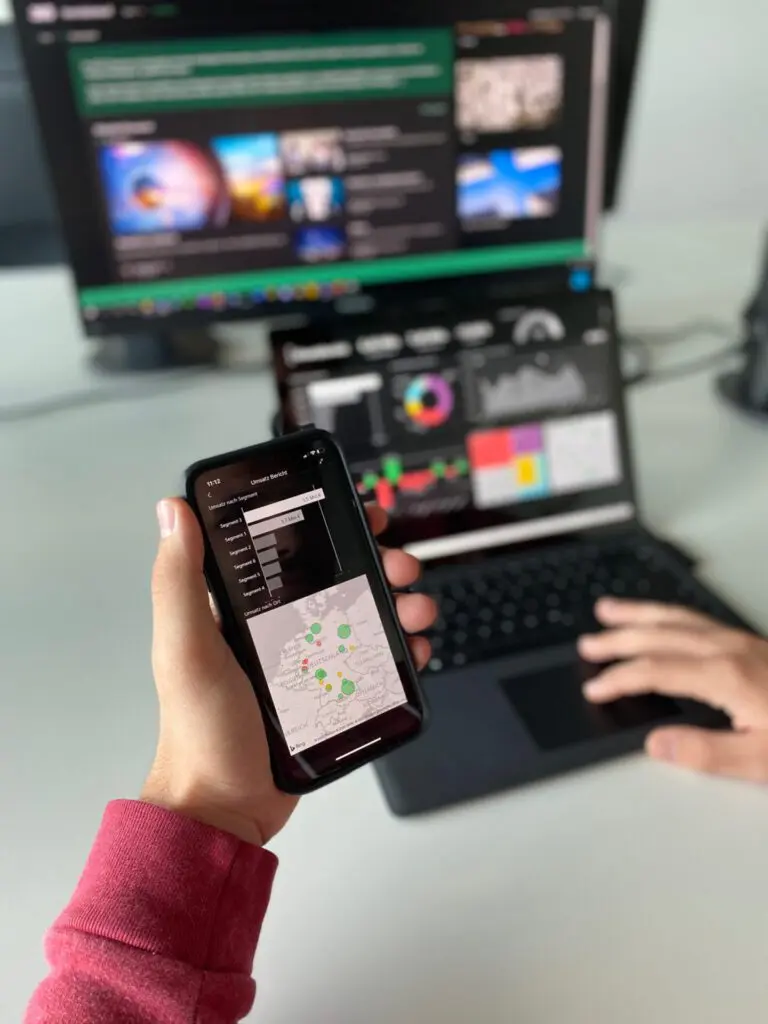
To be alerted, presence at the workplace is not necessary. Whether on the way to a business meeting or from home, access to the cockpit is possible regardless of the device. In real time, the alert is sent to the email inbox or via push message and immediate action can be taken.
Broken down to the divisional and departmental level, everyone can provide their own dashboard accordingly with the metrics they need.
Automated alerting via email, as a push message or in teams
Power BI then warns me when I want it to, if the values I have set show deviations - digitally and automatically by mail.
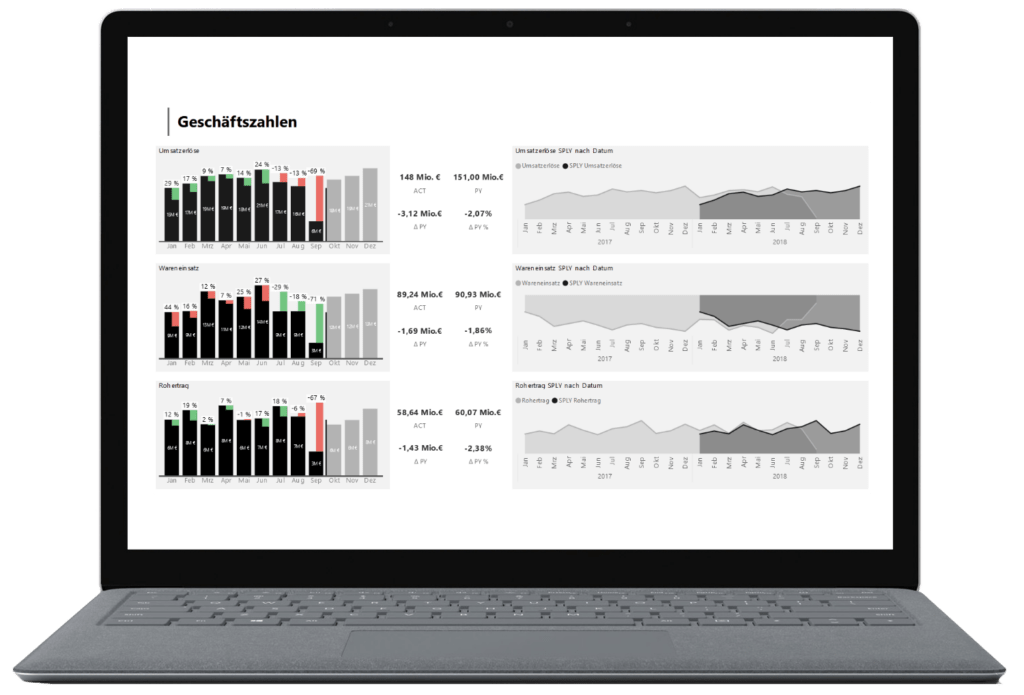
Whether sales figures across all departments or related to one area. From individual reports, required KPIs can be pinned in the dashboard and with the specification of threshold values, the focus is placed on what counts.
If the defined value is exceeded or not reached, the data warning is triggered. The link in the e-mail can be used to access the specially designed dashboard directly. Here, too, the deviation is displayed visually and can hardly be overlooked.
To direct the focus even more on the critical figures, these can also be displayed flashing with additional configurations.

Notification of a data deviation can also be set within teams. As soon as action is required, a notification appears as a banner or in the feed.
You can also conveniently access your report via this and send a message directly to the responsible person(s) or to selected team channels. Convenient, fast and simple.

The updating of the entire system is automated, manual triggering is not necessary.
Everything necessary is centrally bundled in one application.
Can be viewed in real time and from anywhere. Since in the cloud, the discrepancy can be forwarded directly to colleagues and immediate action can be taken.
Central setup and control of data alerting
Through the central control of notifications, individuals, groups of people and even teams can be informed of channels at an early stage. The manual effort for the individual thus becomes superfluous.

The cockpit - from the rough to the fine
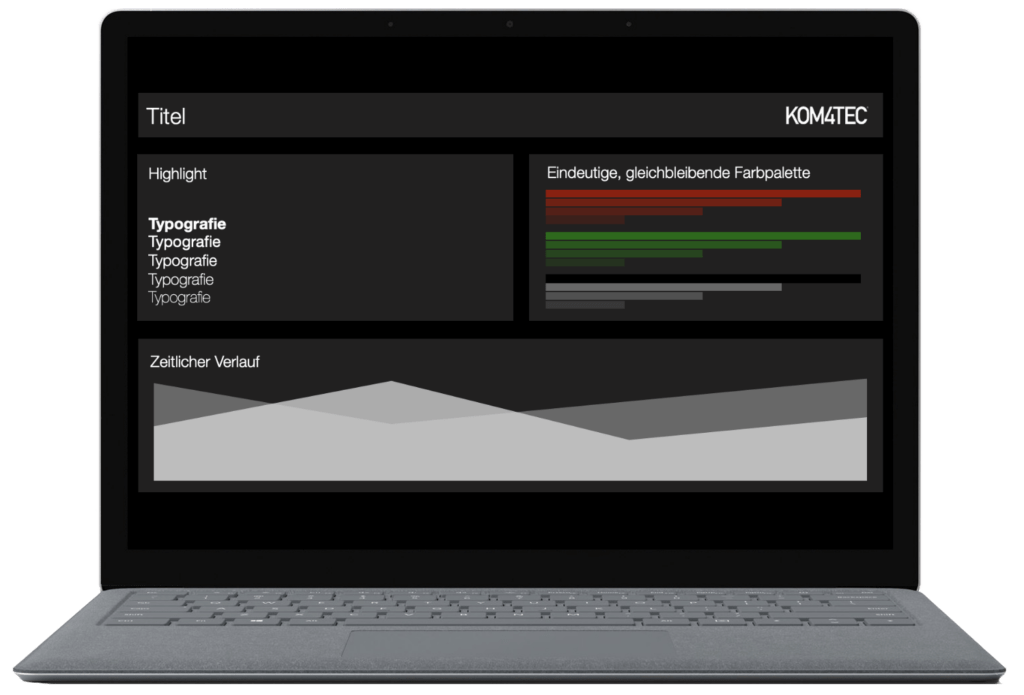
The design of the created cockpit also has a signal effect. With its clean structure, it can also be used in dark mode. The deviations catch the eye directly through colored accents. Initially, only the hard facts are shown here to avoid burdening the consumer with superfluous information. By clicking on the corresponding tiles, the details can be viewed.
The authorization levels can also be set individually, either for a person or for a group. While the manager only needs the rough figures, all the detailed pages can be available for the area manager.

Rigid was yesterday
Thanks to the many configuration options, Power BI is not just a rigid reporting tool. Functions such as data alerting make Power BI an interactive tool that promotes collaboration and communication across departments.
Benefits
- All business-critical key figures in one view
- High availability on desktop and mobile
- Notification in case of deviation
- Focus on critical key figures through visual signal
- Interactive collaboration
- Single point of truth for all stakeholders