We have already built a number of apps for our customers and of course ourselves to simplify and speed up the process of recording proof of performance. In this use case, we will now show you how we developed our proof of service app with Microsoft PowerApps and how it works.
INITIAL SITUATION
Before the app, the entry of performance records and also project bookings was done via our intranet and SharePoint lists. The desire for more mobility was there so that our frequently traveling employees could complete their performance records or project bookings as easily and promptly as possible via smartphone while on the road.
IMPLEMENTATION
The newly developed app can be used to make project bookings and record employee time. Recorded data is stored in an AZURE SQL database. The app has two screens, an input screen for employees and an administration screen. Via a two-step approval process, the captured data can be controlled for the payroll process and approved by the accounting department. Through the use of Power BI, the data is displayed graphically in evaluations and our accounting department can then easily (if everyone has made their entries on time) write invoices.
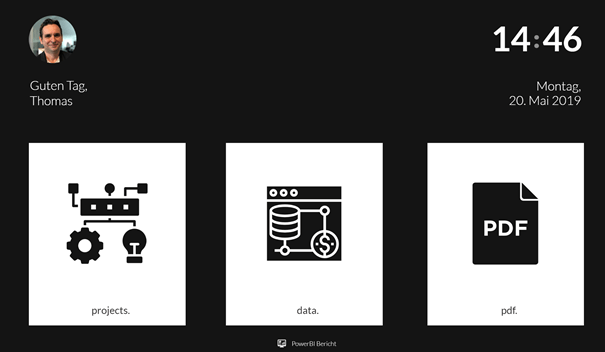
INPUT MODULES
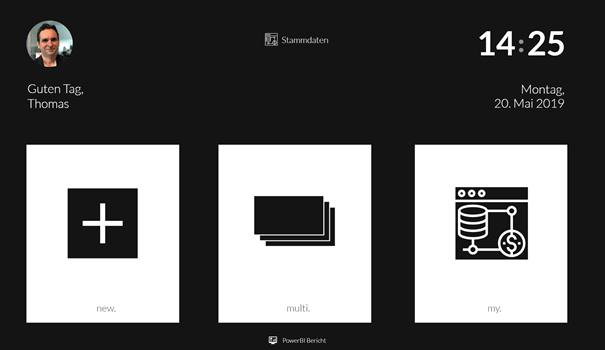
Via the input module, employees can create a new performance record in new. and via multi. on the other hand, multi-entry is possible, i.e. several performance records at once, if they are similar in type, for example. With my. the employee receives an overview of all his entered activity records with filter and editing possibilities. The module master data is only visible for administrators and not for the rest of the employees. We will take a closer look at all four modules in a moment.
NEW.
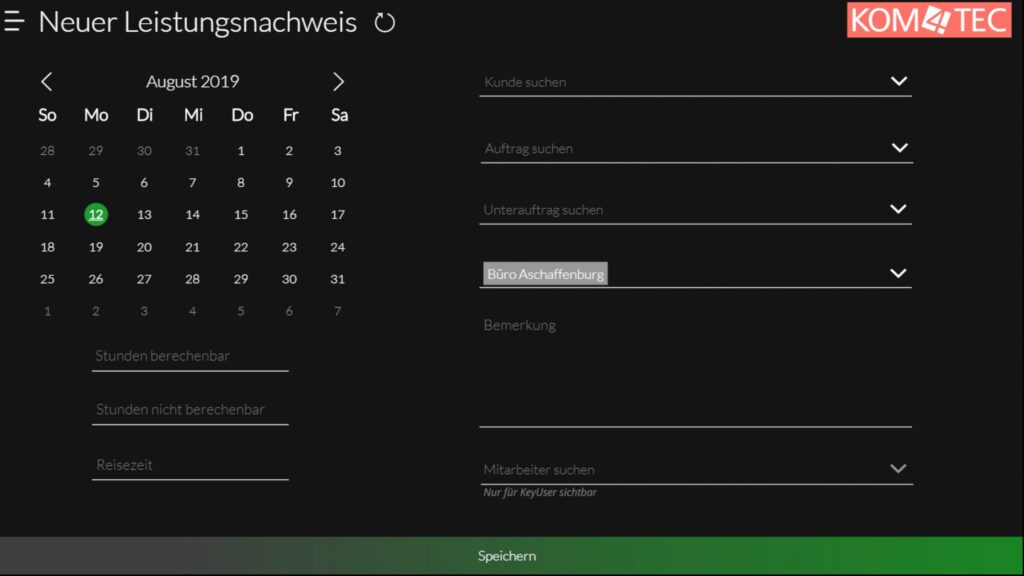
To enter a service record, the following fields must be filled in the input module New service record: The date in a handy calendar, via a drop-down menu the customer, order and if necessary also a sub-order. We distinguish hours into billable and non-billable, i.e. hours that can be charged to a customer and hours that cannot be billed. A description of the service is still necessary, i.e. what was done by the employee. If travel time has been incurred, this can also be entered. Each employee only sees the customers or orders that are relevant for him.
Administrators or all supervisors can also record performance records for their employees with us. They can also assign employees to orders or customers.
MULTI.
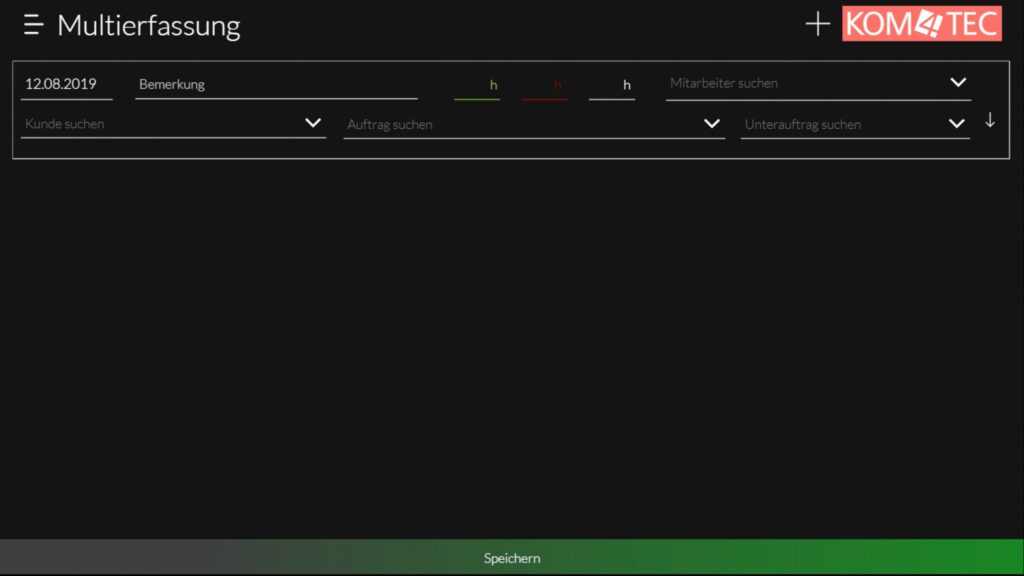
Multi-entry allows the employee to quickly enter multiple service record entries in tabular form. Individual entries (rows) can be easily duplicated using the down arrow. The date field defaults to today's date, but can be changed. After that, one selects the customer, order and sub-order (if available) via the drop-down menu. Here, too, there is a differentiation of the hours into billable in the green field and non-billable in the red field. The travel time, if incurred, can be entered in the white hours field.
MY.
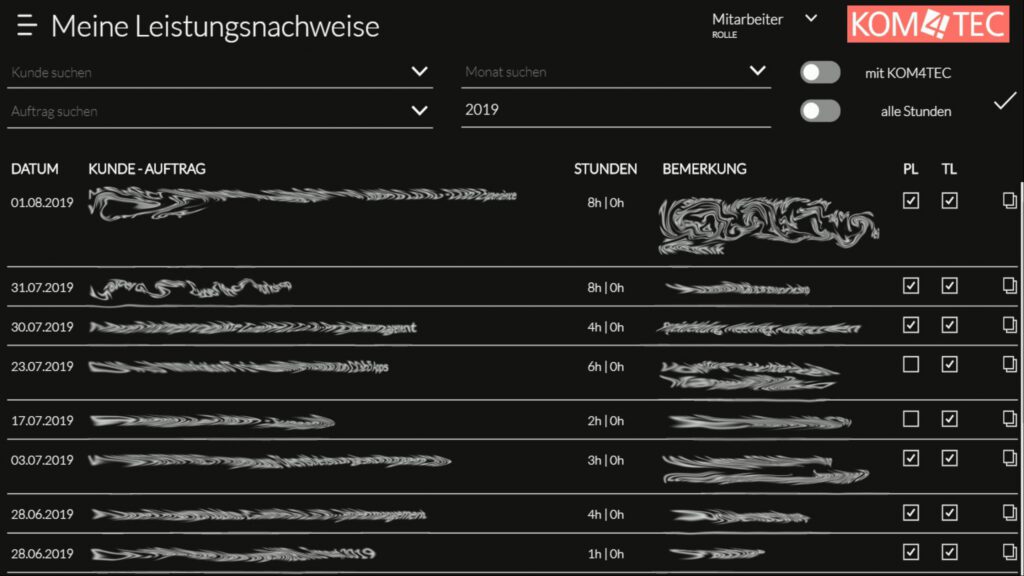
In the my. module, the employee finds an overview of all recorded performance records. Depending on their role, team leaders can also view the performance records of their employees, and project leaders can view the performance records of their projects. In the upper area of the overview there are some filter functions of the performance records. Here you can search by customer, order or month.
RELEASE
The app offers the option of a one-step or two-step approval process for proof of performance.
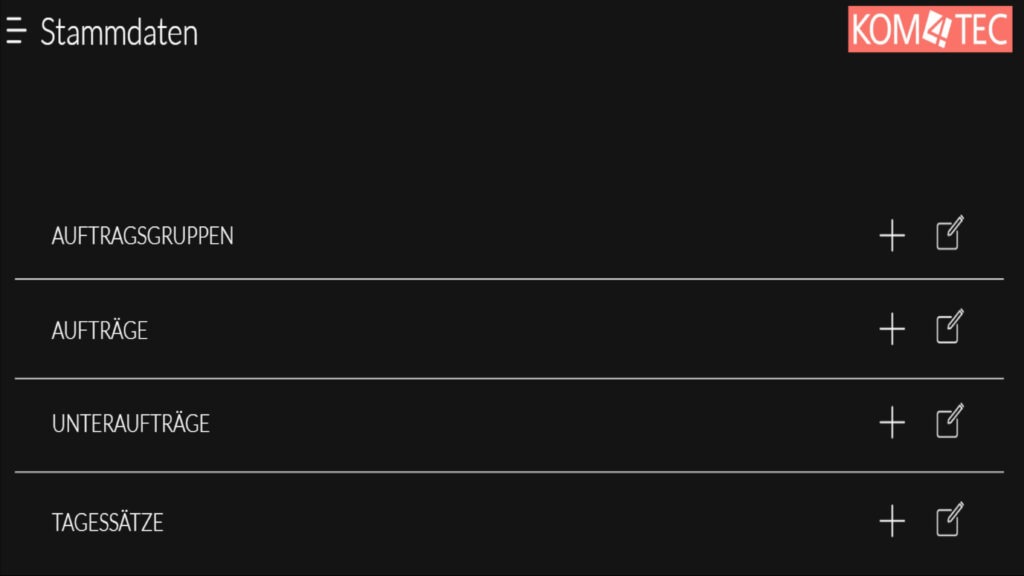
MASTER DATA MODULE
The master data module can be operated only by the administrators. In it, they can enter data via projects. Orders, order groups and daily rates. Under data. you will find an overview of all recorded performance records of all employees. In addition, an output of all monthly performance records as PDF is possible via pdf.
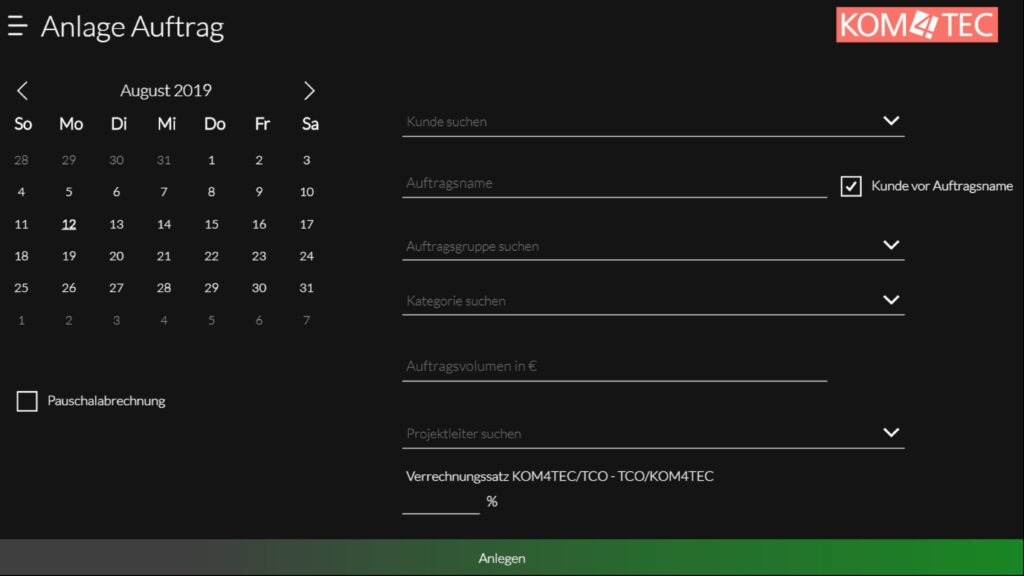
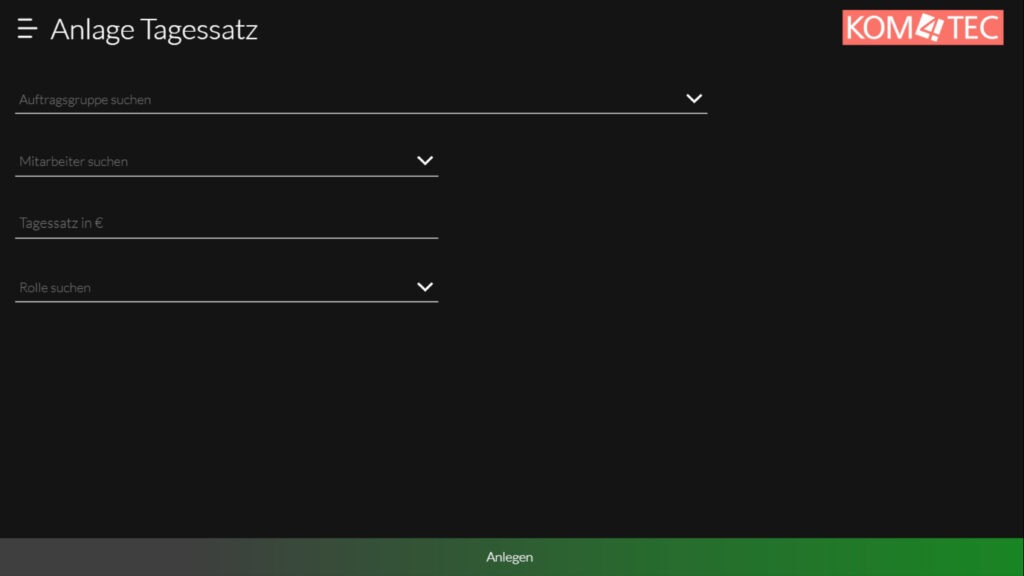
PROJECTS.
Via projects. the master data, i.e. order groups, orders, sub-orders as well as daily rates of the individual employees can be entered by the administrators. This is also where the assignment of employees to orders takes place. Through the assignment, the employees can record their performance records on the corresponding order and are also displayed only "their" and do not have to select from all orders of the entire company.
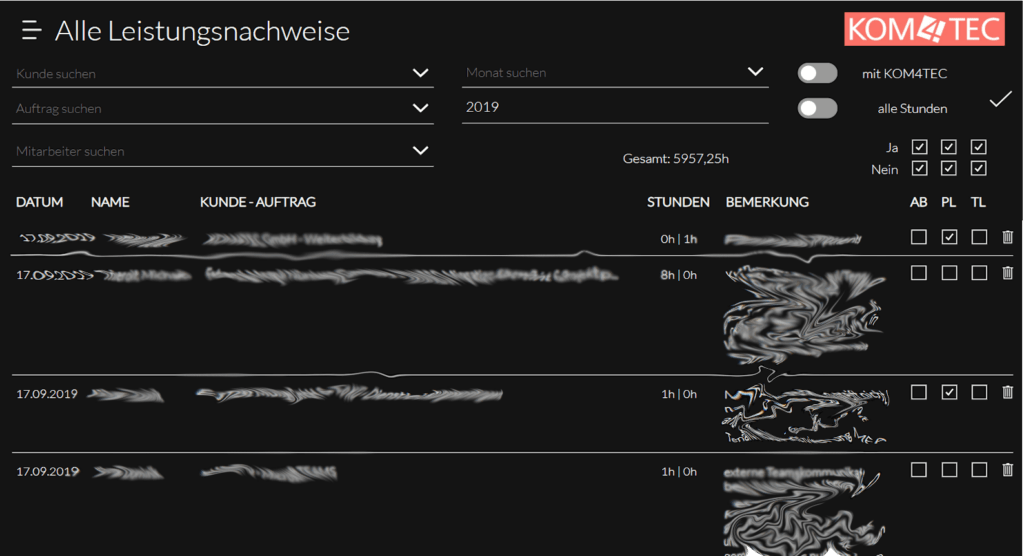
DATA.
In the module data. you will find an overview of all recorded performance records of all employees. In the upper part of the overview there are some filter functions, here you can search by employee, customer, order or month.
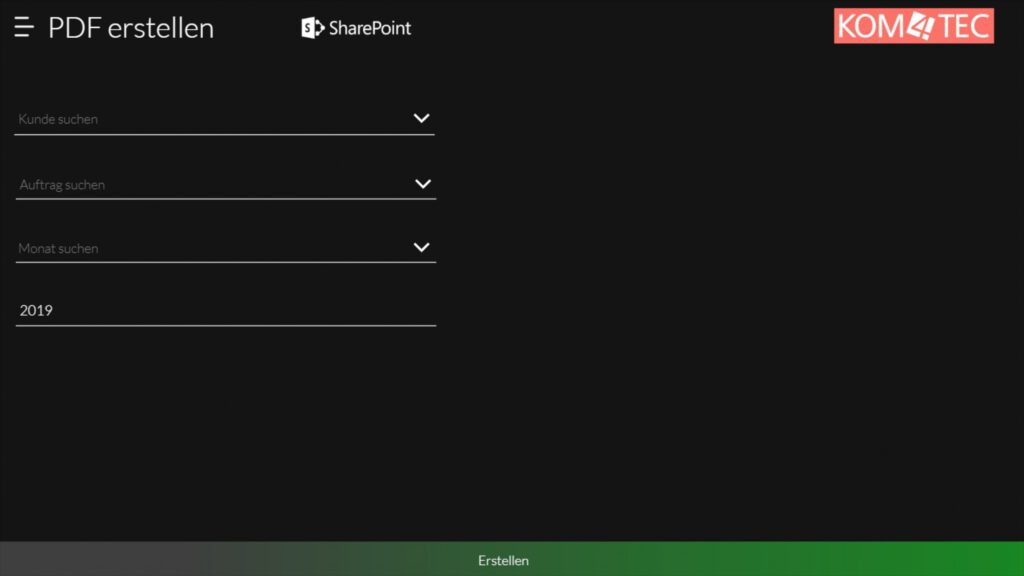
PDF.
When creating the monthly performance statement, the following fields must be selected: The customer, order and the desired month. The monthly activity report will only include activity reports that have been approved by the team leader or project manager. The created activity reports can be automatically stored in a SharePoint document library.
Only performance records that have been approved by the team leader or project manager are included in the monthly performance record. The generated performance records can be automatically stored in a SharePoint document library.
DATA ACQUISITION
To ensure long data retention, we use an Azure SQL database here, as with all our apps and processes. This can be used efficiently in the PowerApp.
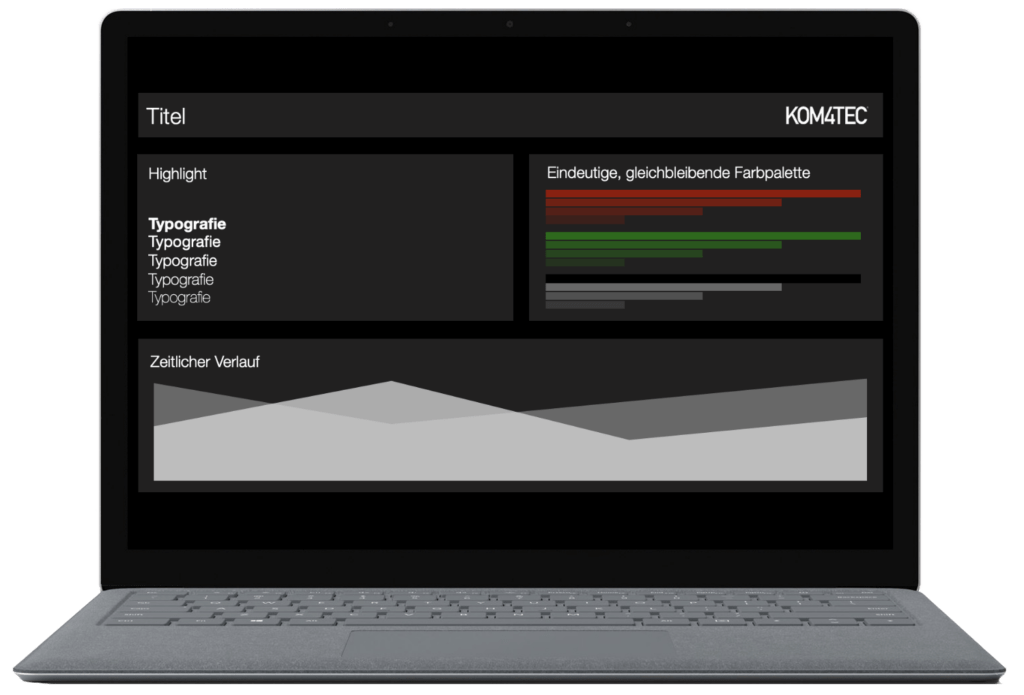
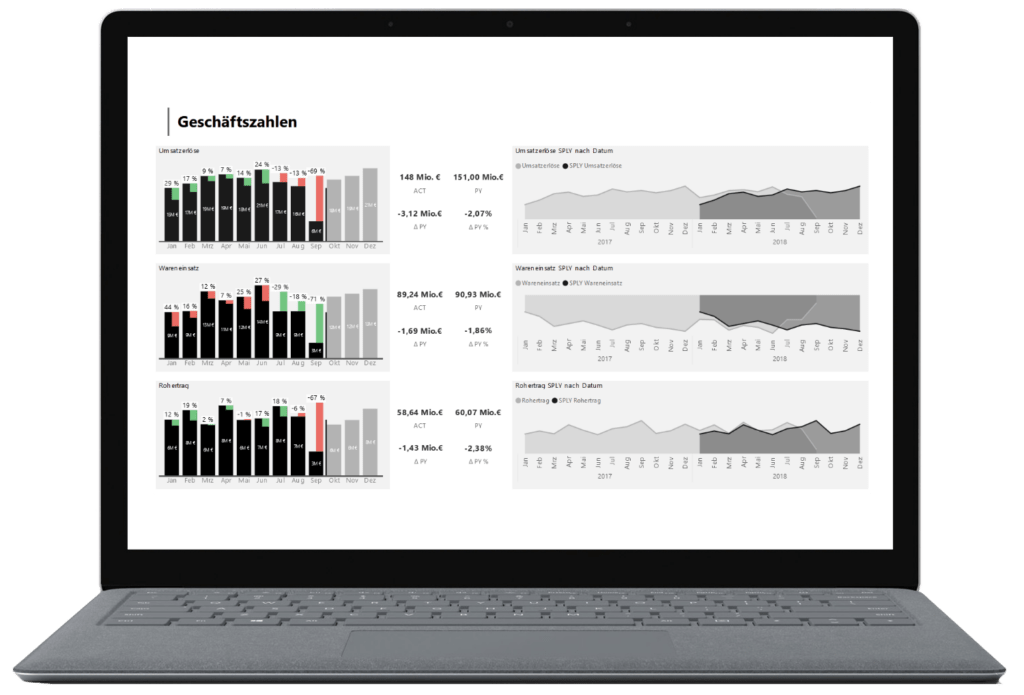
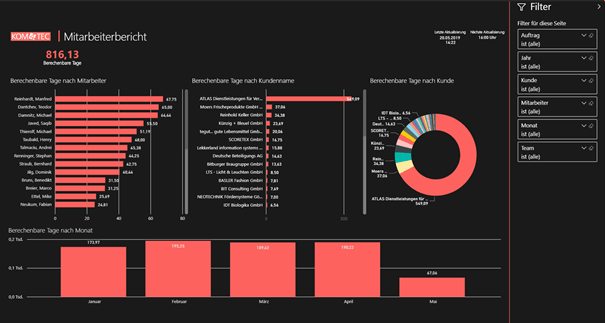
DATA ANALYSIS
An evaluation of the data via Power BI can be used to evaluate the sales of the individual employees. Furthermore, budgets of the individual orders can be monitored. The figures on the sales report dashboard are of course fictitious 😉
CONCLUSION
The introduction of the app has made it much easier to record project times. As a result, there are fewer incorrect bookings by employees, because each employee can only book to the projects assigned to him, and there is less time spent recording project times.
Thanks to the app, we have a better overview of the daily sales figures and the monitoring of project budgets.
Thanks to the performance statement app, mobile recording of project times is now possible. Which is great, of course, because our employees are on the road a lot and can therefore also enter their project times directly afterwards when traveling to our customers.
For invoicing our customers, we can now automatically create performance records as an attachment for the invoices.
We are thrilled with our new product and enjoy working with it every day 🙂